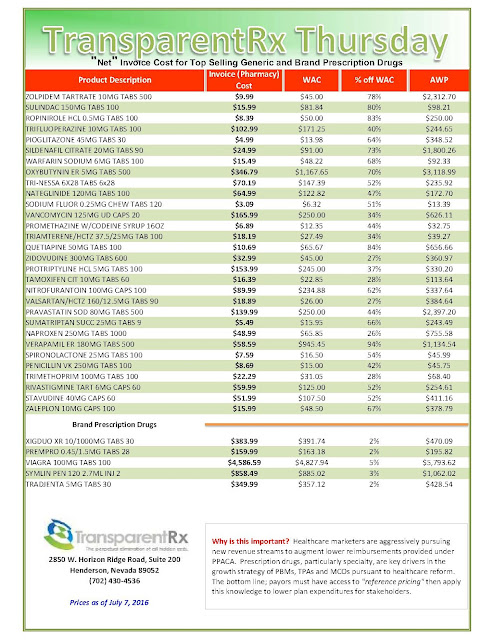
Reference Pricing: “Net” Invoice Cost for Top Selling Generic and Brand Prescription Drugs (Volume 125)
The costs shared below are what the pharmacy actually pays; not AWP, MAC or WAC. The bottom line; payers must have access to “reference pricing.” Apply this knowledge to hold PBMs accountable and lower plan expenditures for stakeholders.
Step #1: Obtain a price list for generic prescription drugs from your broker, TPA, ASO or PBM every month.
Step #2: In addition, request an electronic copy of all your prescription transactions (claims) for the billing cycle which coincides with the date of your price list.
Step #3: Compare approximately 10 to 20 prescription claims against the price list to confirm contract agreement. It’s impractical to verify all claims, but 10 is a sample size large enough to extract some good assumptions.
Step #4: Now take it one step further. Check what your organization has paid, for prescription drugs, against our pharmacy cost then determine if a problem exists. When there is a 5% or more price differential (paid versus actual cost) we consider this a problem.
Multiple price differential discoveries means that your organization or client is likely overpaying. REPEAT these steps once per month.
— Tip —
Always include a semi-annual market check in your PBM contract language. Market checks provide each payer the ability, during the contract, to determine if better pricing is available in the marketplace compared to what the client is currently receiving.
When better pricing is discovered the contract language should stipulate the client be indemnified. Do not allow the PBM to limit the market check language to a similar size client, benefit design and/or drug utilization. In this case, the market check language is effectually meaningless.
Hold middlemen’s feet to the fire to cauterize specialty drug spending
 With no end in sight to the rise in specialty drug prices, experts urge employers to be creative in managing those costs — from building custom networks to holding pharmacy benefit managers accountable for treatment outcomes.
Drugmakers have received the brunt of public outrage for the high prices of some specialty drugs, which require special handling and are used to treat diseases such as cancer, hepatitis C and rheumatoid arthritis. Many specialty drugs are pricey: Epclusa, Gilead Sciences Inc.’s hepatitis C drug that the U.S. Food and Drug Administration approved last week, comes to market at about $75,000 for a single course of treatment.
But experts say employers should be aware of the many middlemen, from PBMs to retailers, that profit from the drug. “When it comes to the distribution of drugs, every time that drug passes through another hand, there’s a margin that’s captured by whoever is handling it. Whether it’s the wholesaler, retailer or a doctor, everybody’s getting a piece,” said Alex Jung, Chicago-based principal of global strategy at Ernst & Young L.L.P.
But employers aren’t doing enough to hold middlemen accountable for the costs they add to the prescription drug bill, and few employers have custom pharmacy networks and direct contracts with health care providers to ensure they pay the lowest costs but get the best outcomes for their employees, she said last week during the Midwest Business Group on Health’s Employer Forum on Pharmacy Benefits and Specialty Drugs in Chicago.
————————
Tyrone’s comment: The key to eliminating pharmacy overpayments is to become highly educated in the pharmacy benefits management industry. Make no mistake about it; much of the excessive remuneration from plan sponsors to PBMs is due to overpaying for pharmaceuticals. For example, mail-order Rx’s are not always less expensive than retail. Another example, preferred pharmacy networks don’t always deliver cost-savings compared to non-preferred networks. In many cases, the opposite is true; they are more expensive! Middlemen want to keep employers in the dark so the cash cow continues to feed them. One can’t hold a PBM accountable if they don’t know exactly how PBMs go about the business of making money.
There are two factors which determine how effective an employer is at paying the lowest possible price while not sacrificing health outcomes: negotiating skills and industry (PBM) knowledge. It is important to recognize that offering a pharmacy benefit is inherently expensive, but with a PBM’s buying power the pain is supposed to be alleviated. However, when PBMs hide cash flows the primary reason we exist is subverted; that is to lower cost for our clients. Instead PBMs seize the opportunity to take advantage of employers’ lack of knowledge and/or desire to keep cost low. Most plan sponsors, and their agents, don’t know what they don’t know.
————————-
Employers need to understand what diseases are prevalent among their employees and “construct a network that meets your needs by looking at a provider that serves those needs from a therapeutic perspective,” she said. “You can’t just say I’m going to follow whatever Boeing (Co.) does or whatever United Airlines (Inc.) does, because … they’re not creating a customized specific benefit plan that meets the needs of the specific therapeutic diseases that are prevalent in your population.”
But most employers don’t have the expertise to navigate the prescription drug industry or devise custom pharmacy networks. And only employers with thousands of employees have the power to form direct contracts, experts say.
Decoding Big Pharma’s Secret Drug Pricing Practices
The pharmaceutical industry has long said that list prices aren’t a reliable indicator of what Americans pay for prescription drugs because big customers, including health insurers and pharmacy benefit managers, negotiate discounts. But a Bloomberg analysis of 39 medicines with global sales of more than $1 billion a year showed that 30 of them logged price increases of more than double the rate of inflation from 2009 to 2015, even after estimated discounts were factored in. Only six drugs had price increases in line with or below inflation.
The analysis is based on discount estimates from SSR Health, an investment research firm that compared estimates of gross sales for each drug, based on prescription data, to company-reported U.S. net sales. To approximate the negotiated prices, Bloomberg compared SSR Health’s estimates for discounts with list prices for the drugs supplied by Connecture Inc., which provides price-comparison software to health plans. Many drug companies disputed the analysis, but none provided specific data to counter it.
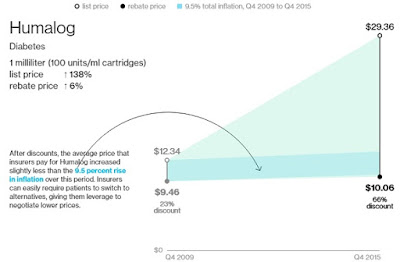
Discounts vary dramatically, depending on disease type and how much competition exists. Take Humalog, the popular, short-acting insulin made by Eli Lilly & Co. Its big list price increases were wiped out by ever-bigger discounts.
 |
| [Click to Enlarge] |
Humalog faces competition from a very similar drug: Novolog, from Novo Nordisk A/S. Benefit managers have been playing one company against the other to get cheaper prices. Lilly offered discounts of 66 percent on Humalog last year, up from 23 percent in 2009, according to SSR Health estimates. Discounts for Novolog have risen in parallel fashion since 2012, the data show.
Lilly said it doesn’t disclose rebates for individual drugs, but, on average, its discounts are 35 percent for commercial insurance plans and 80 percent for government plans. Novo Nordisk said U.S. discounts for all of its medicines were over 50 percent last year, compared with about 35 percent in 2010.
Read more >>
Express Scripts, Anthem Face ERISA Lawsuit Over Drug Pricing
 |
| [Click to Enlarge] |
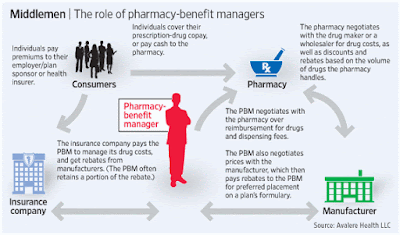
The lawsuit is the latest development in the $15 billion battle between Anthem and Express Scripts. In March, Anthem sued Express Scripts for allegedly overcharging for prescription drugs in violation of the parties’ agreement.
Two months later, two health plan participants sued both companies under the Employee Retirement Income Security Act challenging Express Scripts’ alleged overbilling.
The latest lawsuit, filed June 24 in the U.S. District Court for the Southern District of New York, is brought by participants in three medical plans sponsored by Verizon Communications Inc., AmTrust Financial Services Inc., and LG&E and KU Energy LLC. The plans have more than 26,000 participants combined.
Billion-Dollar Agreement
In December 2009, Express Scripts paid approximately $4.67 billion to Anthem for the exclusive right to provide pharmacy benefit management services, the complaint says. Under this agreement, Express Scripts supports Anthem’s business in over 24 states and services more than 15 million of its members.
According to the complaint, Anthem breached its ERISA duties by entering into an agreement with Express Scripts that was imprudent and not in the best interests of its members. In addition, Anthem allegedly failed to properly monitor and prevent Express Scripts from overcharging.
The complaint alleges that Anthem used Express Script’s nearly $5 billion payment to fund stock buybacks in 2009 and 2010, which ultimately enriched Anthem’s stockholders and management, rather than passing this money through to participants.
Read more >>
Workplaces Fight Skyrocketing Prescription Drug Costs
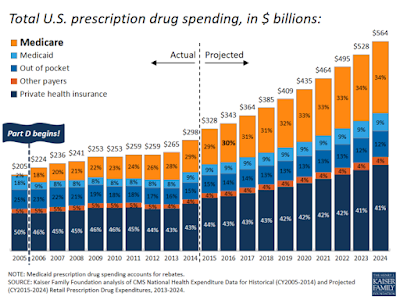
 The estimated price tag for treating a patient with a specialty drug is high. For some chronic conditions, a year of treatment with a specialty drug can exceed $100,000. In many cases, specialty drugs represent only about 1% of all prescriptions but account for one-quarter to one-third of total drug spend.
The most popular cost-controlling methods for organizations are tiered pricing and a mail-order drug service, with 89% and 82% of employers currently implementing these initiatives. As for drug formulary lists, 71% of organizations have this tool in place, and 63% are using a pharmacy benefit manager (PBM).
Tyrone’s comment: CMS conducted an analysis to determine whether or not preferred networks and mail-order drug service deliver on the purported savings. The conclusion is that in some cases they do not. The difference maker is likely two things: negotiation skills and level of PBM industry knowledge.
• Reference-based pricing/cap on certain drugs – 6%
• Collective purchasing groups – 14%
• Coverage of select over-the-counter drugs – 15%
• On-site or near-site pharmacy – 16%
• Discontinued or limited coverage of cosmetic/lifestyle drugs – 17%
• Preferential pricing agreements (negotiated with pharmacies/manufacturers) – 18%
• Drug card program – 28%
• Preferred provider networks – 35%
• Mandated use of generic drugs when available – 37%
• Prior authorization/utilization management – 38%
• Step therapy/therapeutic substitution – 46%
Employers are finding it necessary to vigilantly watch prescription drug prices. They are striving to keep costs controlled by trying new approaches like using five or more tiers for cost sharing, where the highest tier is for the highest-priced drugs—usually specialty drugs. Moving forward, employers will continue exploring unique cost-saving measures like referenced-based pricing.
by Julie Stitch
Review vs Audit: A Comparison of Services Performed by Pharmacy Benefit Management Consultants
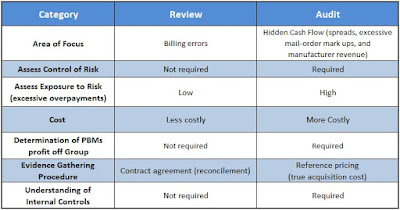
There are two levels of service a consulting firm can perform on a group pharmacy benefit plan: review and audit. In truth, many plan sponsors believe they’re buying an audit when in fact they’re receiving only a review. Because the identification of risk is vastly different between the two consulting services, plan sponsors and their agents should know the differences.
 |
| [Figure 1] |
Review
The problem is that a review provides only limited assurance and is substantially narrower in scope when compared with an audit.
- A review does not include an investigation of the plan sponsor’s internal control system or its risk of excessive overpayments, which could be an area of interest for CEOs, CFOs and plan administrators.
- A review does not use true acquisition cost reference-based pricing. For the most part, a review checks for contract compliance. Errors found during a review are likely just billing mistakes and don’t account for all risks. Risk is measured by exposure to overpayments.
- A review costs less than an audit and, as a result, is often viewed as the preferred option (see figure 1).
- Reviews disclose overpayments related specifically to contract terms. It does not help to disclose payments over AAC (average acquisition costs) or withheld manufacturer revenue which the PBM retains as a service fee or hidden cash flow.
The lesson here is that a company should hold an in-depth discussion in advance of the consulting firm’s initial engagement to ensure that there is sufficient value in performing a review, or determine whether a different option would be better fit. Ultimately, a review is a very effective option for companies that are comfortable with the limited assurance given in the report.
Audit
An audit provides the highest level of assurance that the plan sponsor is free from excessive overpayments. Under an audit, the pharmacy benefit management consulting firm is required to:
- Obtain an understanding of the client company’s internal controls and assess hidden cash flow (paid) risk.
- Corroborate figures and disclosures included in the final report by obtaining audit evidence through inquiry, physical inspection, observation, third-party confirmation, examination, analytical procedures and other procedures.
- The audit is usually substantially higher in cost than a review. However, the evaluation of risk (overpayments) is more substantial compared to a review.
Often overlooked, in far too many PBM contracts, is how much cash the PBM actually generates for itself; on a per client basis. I have a simple equation that every consultant, broker and benefits expert should employ to calculate PBM service costs but few do. Here it is absence of charge:
When plan sponsors can account for PBM service revenues they make better decisions about their pharmacy spend. In addition, they will discover the key to cost-containment in the pharmacy benefit is primarily mitigating the PBMs profit not the pharmaceuticals.
Some might bark at this notion but keep this in mind. Offering a pharmacy benefit is inherently expensive thus the key is not to overpay. Groups achieve this by making sure they benefit more from the PBMs buying power than the PBM itself.
Choosing an audit or a review is mainly a question of your needs and the needs of your stakeholders. Should cost be considered? Yes, but it should not be the driving factor unlike the choice for a PBM vendor. Proper planning and discussions with your cross-functional team should yield the right decision for your company – one that will fulfill your needs in the most cost-effective manner.
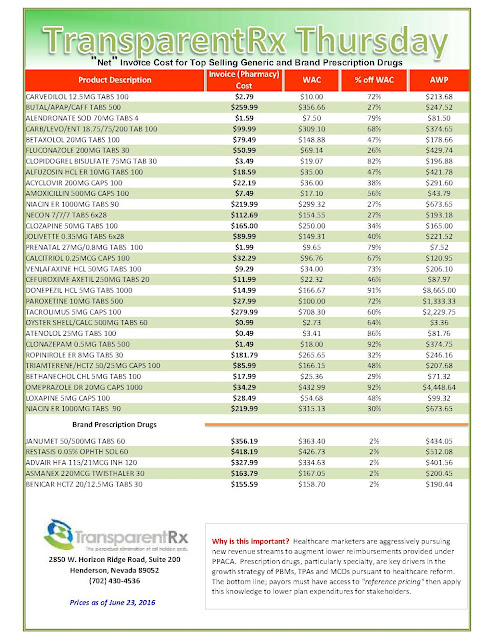
Reference Pricing: “Net” Invoice Cost for Top Selling Generic and Brand Prescription Drugs (Volume 124)
The costs shared below are what the pharmacy actually pays; not AWP, MAC or WAC. The bottom line; payers must have access to “reference pricing.” Apply this knowledge to hold PBMs accountable and lower plan expenditures for stakeholders.
Step #1: Obtain a price list for generic prescription drugs from your broker, TPA, ASO or PBM every month.
Step #2: In addition, request an electronic copy of all your prescription transactions (claims) for the billing cycle which coincides with the date of your price list.
Step #3: Compare approximately 10 to 20 prescription claims against the price list to confirm contract agreement. It’s impractical to verify all claims, but 10 is a sample size large enough to extract some good assumptions.
Step #4: Now take it one step further. Check what your organization has paid, for prescription drugs, against our pharmacy cost then determine if a problem exists. When there is a 5% or more price differential (paid versus actual cost) we consider this a problem.
Multiple price differential discoveries means that your organization or client is likely overpaying. REPEAT these steps once per month.
— Tip —
Always include a semi-annual market check in your PBM contract language. Market checks provide each payer the ability, during the contract, to determine if better pricing is available in the marketplace compared to what the client is currently receiving.
When better pricing is discovered the contract language should stipulate the client be indemnified. Do not allow the PBM to limit the market check language to a similar size client, benefit design and/or drug utilization. In this case, the market check language is effectually meaningless.
The 7 Habits Of Highly Effective Benefits Professionals
Habit #1: First things first: Value-based primary is the bedrock of the highest-functioning health systems
Value-based primary care stands in stark contrast to the milk-in-the-back-of-the-store primary care model that has been a pervasive driver of the scourge of over-treatment. Grassroots change at the city level is recognizing the importance of primary care and how it can attract major employers. IBM IBM +0.85% is a leading example of how wise organizations recognize that health benefits are the second biggest cost input into their business. Like any other item in their supply chain, they will shift to high-value suppliers. It turns out that locating jobs in high-value healthcare communities boils down to those communities with the strongest foundation of valued-based primary care.
Habit #2: Be proactive managing pharmacy benefits
Successful Rx management has been described as playing whack-a-mole. The pharmacy benefits management (PBM) industry has many firms that are well known for hidden fees, shell game pricing and taking drug manufacturers’ money to promote specific drugs.
There are three pillars to manage drug cost and quality:
- Review PBM arrangements to determine the “spread” (PBM profit) and whether more favorable terms are available.
- Formulary changes that create a large financial impact with next to no disruption.
- Carefully manage specialty drug acquisition and use.
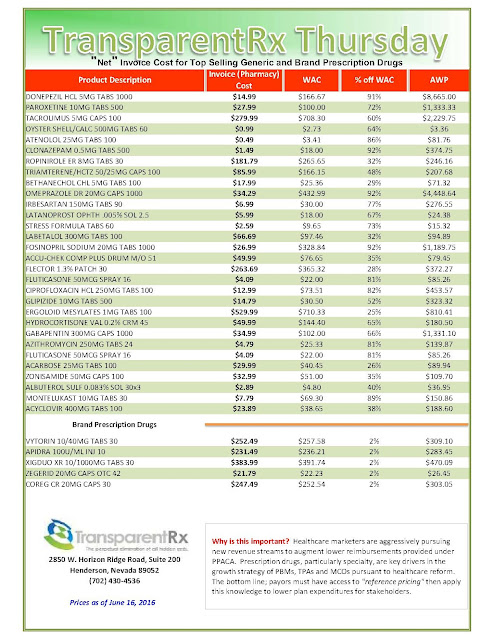
Reference Pricing: “Net” Invoice Cost for Top Selling Generic and Brand Prescription Drugs (Volume 123)
The costs shared below are what the pharmacy actually pays; not AWP, MAC or WAC. The bottom line; payers must have access to “reference pricing.” Apply this knowledge to hold PBMs accountable and lower plan expenditures for stakeholders.
Step #1: Obtain a price list for generic prescription drugs from your broker, TPA, ASO or PBM every month.
Step #2: In addition, request an electronic copy of all your prescription transactions (claims) for the billing cycle which coincides with the date of your price list.
Step #3: Compare approximately 10 to 20 prescription claims against the price list to confirm contract agreement. It’s impractical to verify all claims, but 10 is a sample size large enough to extract some good assumptions.
Step #4: Now take it one step further. Check what your organization has paid, for prescription drugs, against our pharmacy cost then determine if a problem exists. When there is a 5% or more price differential (paid versus actual cost) we consider this a problem.
Multiple price differential discoveries means that your organization or client is likely overpaying. REPEAT these steps once per month.
— Tip —
Always include a semi-annual market check in your PBM contract language. Market checks provide each payer the ability, during the contract, to determine if better pricing is available in the marketplace compared to what the client is currently receiving.
When better pricing is discovered the contract language should stipulate the client be indemnified. Do not allow the PBM to limit the market check language to a similar size client, benefit design and/or drug utilization. In this case, the market check language is effectually meaningless.
- Go to the previous page
- 1
- …
- 106
- 107
- 108
- 109
- 110
- 111
- 112
- …
- 144
- Go to the next page

