Another request for proposal (RFP) season has passed, and I am as befuddled by the process today as I was ten years ago. Thousands of questions, dozens of finalist presentations and never once was a signature-ready contract demanded at the beginning of the competitive bidding process. It wasn’t until after the winner was selected that the PBM service agreement became a topic of discussion. The three most crucial activities during an RFP are contract drafting, contract negotiation, and contract memorializing with a PBM.
Apex Benefits understands the status quo is flawed so they opted to create an internal Peer Review Process (PRP). The PRP is a proactive four-step process for reviewing and discovering potential avenues to save on medical and pharmacy costs. Importantly, contract analysis and scoring are an integral part of their review process. The benefits of a peer review process include information symmetry, increased efficiency, better clinical and financial pharmacy benefit performance. Here are 5 metrics every PBM should be measured by during and after a competitive bidding process:
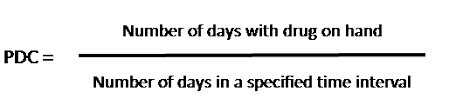
- Adherence. The most often used metrics for drug adherence, based on refill records, are medication possession ratio (MPR) and proportion of days covered (PDC). I recommend PDC as it does not give credit for refilling a script early. The US Centers for Medicare and Medicaid Services has included PDC in its plan evaluations, and the Pharmacy Quality Alliance has endorsed it as its suggested adherence metric. Even now, accreditation authorities like URAC are starting to demand PDC in authorized organizations’ annual reports. Employers could be spending millions of dollars to provide a pharmacy benefit only for most of the money to be wasted when medication adherence is poor. Goal ≥ 80%.
- Brand Effective Rate (BER). Means the average percent discount off the AWP for all brand drugs. If paid at NADAC or average sales price (ASP), ingredient cost is backed into the AWP to calculate the discount off the AWP. Goal ≥ 18% with weighted averages applied to each channel (i.e. mail, R30).
- Generic Effective Rate (GER). The average percent discount off the AWP whether paid at MAC, U&C, NADAC, or AWP discount. GER is a crucial performance metric but must be measured with a trained eye. Cost offsets should not be permitted, for instance. A cost offset permits overperformance in one criterion to applied to a different criterion which underperformed. GER allows for the fairest comparison of PBM generic reimbursement rates which accounts for 90% of all prescription drug claims. Goal ≥ 88% with weighted averages applied to each channel (i.e. mail, R90).
- Generic Dispensing Rate (GDR). The percentage of all prescriptions that are dispensed as generic. If there are 83 generic claims out of 100 claims, the generic dispensing rate or GDR is 83%, for instance. According to HealthPartners data, a one percentage point increase in use of generics could cut pharmacy costs by around 5%. Goal ≥ 90%.
- Per Member Per Month (PMPM). There is one immutable truth in pharmacy benefits management. PMPM is the most important financial metric to plan sponsors in the world of pharmacy benefits management. Why, do you ask? PMPM takes into consideration ingredient cost (net of rebates), clinical performance such as step therapy or prior authorization where product mix and utilization are the primary cost drivers, ancillary fees like manufacturer assistance programs, and the PBM management fee. Goal < $80 PMPM.
When the state of Ohio discovered about $225,000,000[i] in secret cash flows from only two PBMs in a single year, it is what caused it to terminate those two PBM contracts. Ohio switched to include PBM management fees in their PBM financial audit instead of relying on discount assurances and rebates. EACD, also known as earnings after cash disbursements, is the sum of money retained by a PBM in exchange for its services. Only after learning how much money a PBM keeps for themselves do you start to understand the scope of overpayments.
If PBM ‘A’ proposes $63 PMPM annual cost and PBM ‘B’ proposes $88, one can safely assume the $25 PMPM cost difference is revenue to the PBM or its third-party vendors. A group with 8000 members pays PBM ‘B’ an extra $2.4 million per year for the management fee alone! Understanding and implementing the PBM’s management fee or EACD in your RFPs is necessary for running a successful pharmacy benefits program. The PBM must be willing to share both the amount and the source of its financial flows. Move on if it balks.
5 Metrics Every PBM Should Be Measured By
Generally speaking, plan sponsors aren’t taking the Consolidated Appropriations Act seriously. Sure, you want the annual reports submitted on time but that is the extent of it. The Feds are forcing you to do what they believe you have failed to do in the past – get educated and forge a new path to managing pharmacy benefits cost-effectively. It starts with your competitive bidding process. Big AWP discounts and minimum rebate guarantees have been used as a distraction. There are two things a non-fiduciary PBM can’t hide from: radically transparent contract language and a guaranteed PMPM cost.
[i] Meltzer, R. August 2016. Ohio cracks down on PBM contracts after audit shows egregious spread pricing in Medicaid. December 1, 2022. https://www.fiercehealthcare.com/regulatory/ohio-takes-action-after-finding-pbms-engaged-egregious-spread-pricing-medicaid