Many directors of benefits review their PBM’s reports and assume the numbers tell the full story. But without understanding the fundamental calculations behind key performance metrics, it’s easy to miss hidden costs and misleading figures. PBMs often present data in ways that obscure true performance, making it difficult to assess whether you’re getting the best value. To take control of your pharmacy spend, you need to know not just what to measure, but how those numbers are calculated. Here are six PBM performance metrics every director of benefits must understand.
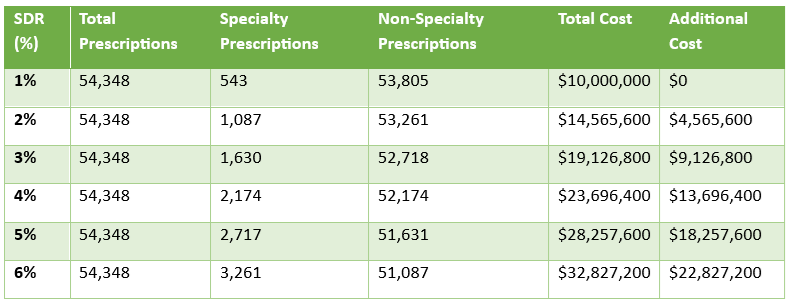
- Specialty Dispensing Rate (SDR) is defined as the percentage of all dispensed prescriptions that are specialty drugs. Specialty drugs are high-cost medications used to treat complex, chronic conditions such as cancer, rheumatoid arthritis, and multiple sclerosis. These drugs often require special handling, administration, or monitoring. Figure 1 assumes an average cost of $8500 per 28-day supply for a specialty drug claim and $100 for a non-specialty prescription drug claim. Goal < 2.5%.
- Generic Effective Rate (GER) is the average percent discount off the AWP for all generic drugs whether reimbursed at MAC, usual and customary pricing, or AWP discount. Because nine out of ten dispensed drugs are generic, the GDR performance metric is especially important. It can be difficult to catch where you are losing money until it is too late. You want to catch overpayments early enough to make the proper adjustment(s). Continuously monitor your GER so any overpayments to PBMs don’t pile up. Analyze performance by channel i.e. retail 30, retail 90 etc. If your pricing benchmark is NADAC, back in the ingredient cost + professional dispensing fee to calculate the NADAC effective rate (NER). Goal > 88%.
- Generic Dispense Rate (GDR) or generic dispensing ratio is the number of generic fills divided by the total number of prescriptions. GDR is a standard performance metric on which our formulary manager is regularly evaluated. For every 1% increase in GDR a plan can expect to realize a 5% reduction in gross drug spend! Both GDR and GSR are indicators of how well clinical programs are performing. For example, loose utilization management will produce a poor (i.e. 84%) GDR. Goal > 90%.
- Proportion Days Covered (PDC) is a commonly used metric in pharmacy benefits management to measure medication adherence. It represents the percentage of days within a specified period (usually 6 or 12 months) during which a patient has access to their prescribed medication. Unlike the Medication Possession Ratio (MPR), PDC accounts for overlapping prescriptions and is capped at 100%, making it a more reliable indicator of adherence. Goal > 80%.
- Total Cost of Care (TCOC) in pharmacy benefits is the overall financial impact of prescription drug spending on a health plan, factoring in both direct and indirect costs. It goes beyond just drug prices and rebates to include medical cost offsets, patient adherence, PBM cost-shifting tactics, utilization management effectiveness, and member cost-sharing. A low pharmacy spend doesn’t always mean lower healthcare costs—if restrictive formularies or high patient out-of-pocket costs lead to increased hospitalizations or complications, the total cost of care rises. Evaluating pharmacy benefits through this lens ensures cost containment efforts don’t create bigger financial burdens elsewhere. Goal = $960 PMPY x number of members.
- Per Member Per Month (PMPM) is the most fundamental cost indicator for financial benchmarking in pharmacy benefits. As such, every proposal should include a projected PMPM. Additionally, incumbent PBM cost performance should be measured by change in PMPM YOY for both whole dollars and percentage. It is calculated by dividing the total annual cost or revenue by the number of member months. Goal < $80 PMPM.
Every metric outlined above assumes clean claims—no reclassifications, exclusions, or manipulated data. When analyzing PBM performance, it’s critical to compare apples to apples, as PBMs are notorious for reclassifying drugs, reducing claim counts, and using other tactics to make their numbers look better than reality. If you don’t fully understand how these metrics are calculated, a non-fiduciary PBM will exploit your knowledge gap.
Conclusion – PBM performance metrics
Reviewing reports isn’t enough—you need to dig into the math behind the numbers to hold them accountable. A Playbook for Employers Addressing Pharmacy Benefit Management Misalignment could be your best resource for navigating these challenges, especially page seven. If you’re serious about cutting through the smoke and mirrors, let’s talk.