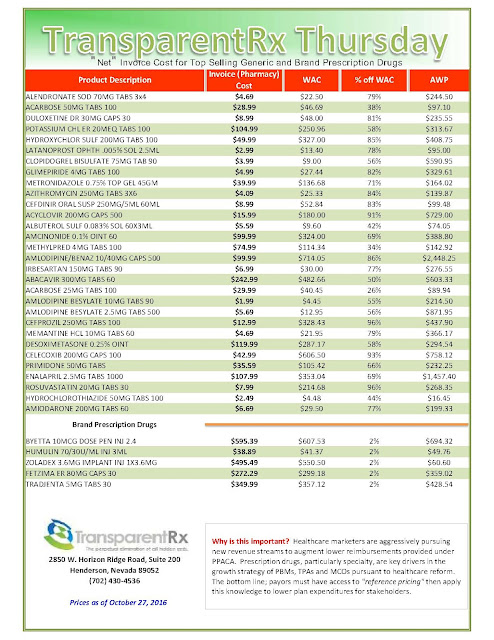
“Gross” Invoice Cost for Top Selling Generic and Brand Prescription Drugs – Volume 141
The costs shared below are what the pharmacy actually pays; not AWP, MAC or WAC. The bottom line; payers must have access to “reference pricing.” Apply this knowledge to hold PBMs accountable and lower plan expenditures for stakeholders.
Step #1: Obtain a price list for generic prescription drugs from your broker, TPA, ASO or PBM every month.
Step #2: In addition, request an electronic copy of all your prescription transactions (claims) for the billing cycle which coincides with the date of your price list.
Step #3: Compare approximately 10 to 20 prescription claims against the price list to confirm contract agreement. It’s impractical to verify all claims, but 10 is a sample size large enough to extract some good assumptions.
Step #4: Now take it one step further. Check what your organization has paid, for prescription drugs, against our pharmacy cost then determine if a problem exists. When there is a 5% or more price differential (paid versus actual cost) we consider this a problem.
Multiple price differential discoveries means that your organization or client is likely overpaying. REPEAT these steps once per month.
— Tip —
Always include a semi-annual market check in your PBM contract language. Market checks provide each payer the ability, during the contract, to determine if better pricing is available in the marketplace compared to what the client is currently receiving.
When better pricing is discovered the contract language should stipulate the client be indemnified. Do not allow the PBM to limit the market check language to a similar size client, benefit design and/or drug utilization. In this case, the market check language is effectually meaningless.
Note: Prices listed herein are gross thus do not account for rebates, discounts or other purchase incentives which ultimately reduces the net cost.
Survey supports transparency of drug pricing by pharmacy benefit managers
Pharmacy benefit managers (PBMs) have come under fire recently due to outrage over high drug prices, with some critics blaming PBMs for the cost growth. However, many PBMs attest that they have been saving patients and the healthcare industry money through their negotiated drug costs and formulary exclusion lists.
PBMs are also faced with rising drug costs, and they respond by removing drugs from their formulary lists when a less costly alternative is available. Since they can use these lists to negotiate prices, these policies have largely had a positive impact on costs, and have not been seen to affect patient access to medications, according to the Pharmacy Benefit Management Institute’s 2016 PBM Customer Satisfaction Report.
 |
| Figure 1 |
Approximately 83% of plan sponsors indicated that their PBM is also aligned with their goals, which is important so employees can receive the services and care that is needed.
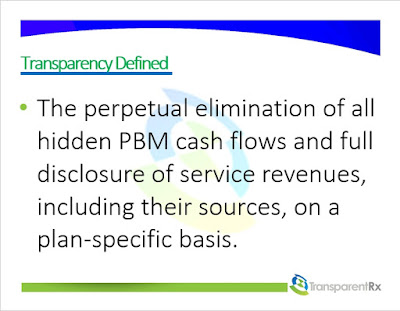
Tyrone’s comment: There is no standard industry definition for transparency so how is it defined and, more importantantly, measured here? I offer up a definition above (figure 1). Finally, I don’t for a second think plan sponsors would believe their PBM to be completely transparent if they knew the truth behind the numbers. I speak with dozens of Benefits Directors, Benefits Consultants and CFOs weekly only to discover how little they know about PBM fundamentals such as plan design and cost-containment. So its not surprising to see such positive survey results when the respondents’ heads are in the sand.
Plan sponsors also rated 5 of 9 PBM functions an 8 or higher on the satisfaction scale. Retail network options received the highest rating of 8.5 in the survey.
The respondents rated formulary management the highest rated noncore service, and consumer education tools as the lowest. Interestingly, the highest- and lowest-rated services were only separated by 0.5 points.
Delivery of services and utilization management scored a 7.9 for the specialty aspects of the PBM, the researchers said. Satisfaction across all service dimensions did not significantly change from 2015.
Overall, plan sponsors were likely to renew their contracts with their PBM, and ranked that likelihood an 8.1. These findings suggest that PBMs are achieving their goals of providing beneficial services, driving positive patient outcomes, and reducing drug costs, according to the report.
“Our research shows that PBMs who can deliver high quality services, have aligned goals with clients, and help maintain employee and member satisfaction in turn have highly satisfied customers,” Jane Lutz, executive director of Pharmacy Benefit Manager Institute, said in a press release. “In the competitive PBM marketplace, customer satisfaction is a key differentiator. Highly satisfied customers are more likely to renew services with their current PBM and even refer potential customers to their existing PBM.”
by Laurie Toich
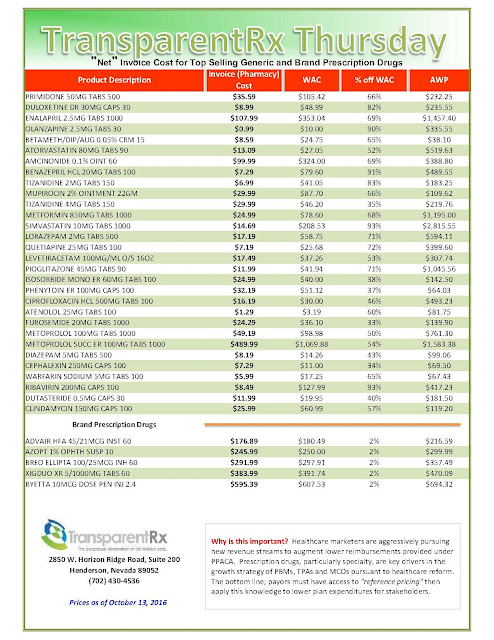
“Gross” Invoice Cost for Top Selling Generic and Brand Prescription Drugs – Volume 140
The costs shared below are what the pharmacy actually pays; not AWP, MAC or WAC. The bottom line; payers must have access to “reference pricing.” Apply this knowledge to hold PBMs accountable and lower plan expenditures for stakeholders.
Step #1: Obtain a price list for generic prescription drugs from your broker, TPA, ASO or PBM every month.
Step #2: In addition, request an electronic copy of all your prescription transactions (claims) for the billing cycle which coincides with the date of your price list.
Step #3: Compare approximately 10 to 20 prescription claims against the price list to confirm contract agreement. It’s impractical to verify all claims, but 10 is a sample size large enough to extract some good assumptions.
Step #4: Now take it one step further. Check what your organization has paid, for prescription drugs, against our pharmacy cost then determine if a problem exists. When there is a 5% or more price differential (paid versus actual cost) we consider this a problem.
Multiple price differential discoveries means that your organization or client is likely overpaying. REPEAT these steps once per month.
— Tip —
Always include a semi-annual market check in your PBM contract language. Market checks provide each payer the ability, during the contract, to determine if better pricing is available in the marketplace compared to what the client is currently receiving.
When better pricing is discovered the contract language should stipulate the client be indemnified. Do not allow the PBM to limit the market check language to a similar size client, benefit design and/or drug utilization. In this case, the market check language is effectually meaningless.
Note: Prices listed herein are gross thus do not account for rebates, discounts or other purchase incentives which ultimately reduces the net cost.
Employers Overpay 10-50% on Health Benefits: Time for a Second Opinion
Tyrone’s comment: Similarly, I’m astonished that I continue to come across third-party payers, such as self-funded employers, who don’t know how much they pay PBMs and/or TPAs for managing the pharmacy benefit. This is far different than net plan costs as the PBMs take is hidden in the total pharmacy spend.
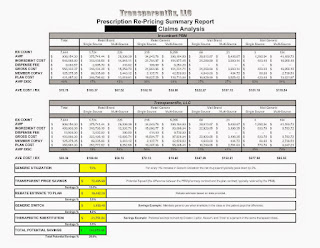 |
| Price comparison: non-fiduciary PBM (incumbent) vs. fiduciary PBM |
At the big picture level, PwC has pointed out that more than half of healthcare spending adds no value (PDF). At a ground level, we see employers spending 55% less on health benefits with a benefits package better than 99% of the workforce. In other words, the best way to slash healthcare costs is to improve benefits.
Suddenly, CEOs (and CFOs) recognize the annual health benefits Kabuki dance is jeopardizing the viability of their business. CEOs are running the numbers and recognize that they are a benefits renewal or two from being put out of business and finally scrutinize healthcare spending like they do any other input.
I recently spoke with John Torinus (Chairman of Serigraph and author of the book, The Company That Solved Healthcare). Torinus described how manufacturers are managing costs two or three points to the right of the decimal point. Meanwhile they were seeing 100% or more variance in healthcare costs with no correlation to value.
Tyrone’s comment: Unlike manufacturers, most self-funded employers are managing pharmacy costs six or seven points to the left of the decimal point! There is a simple litmus test to help determine whether or not my theory is true. Ask yourself, “what is our PBM’s and/or TPA’s take for providing pharmacy benefit management services to our organization?” If you have no clue you are overpaying unless of course your PBM entered into a fiduciary agreement with you. Otherwise, you’d be wise to learn how to manage pharmacy costs two or three points to the right of the decimal point.
If fixes already exist, why isn’t everyone using them?
Healthcare’s redemption is a classic example of solutions hidden in plain site. Noted business consultant and author Ric Merrifield summed this up during message testing: “The Big Short, and Moneyball, had one major theme in common–in the face of a mountain of evidence, the evidence was ignored… Wall Street and regulators didn’t downgrade the credit ratings of the mortgage backed securities even when the mountain of evidence was presented to them. So why should we expect healthcare to be any different? Healthcare is in the same place at the moment. The healthcare mess in many ways is happening in broad daylight.”
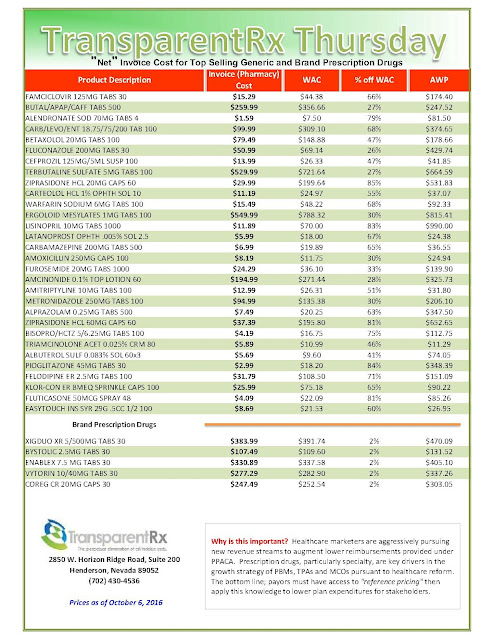
“Gross” Invoice Cost for Top Selling Generic and Brand Prescription Drugs – Volume 139
The costs shared below are what the pharmacy actually pays; not AWP, MAC or WAC. The bottom line; payers must have access to “reference pricing.” Apply this knowledge to hold PBMs accountable and lower plan expenditures for stakeholders.
Step #1: Obtain a price list for generic prescription drugs from your broker, TPA, ASO or PBM every month.
Step #2: In addition, request an electronic copy of all your prescription transactions (claims) for the billing cycle which coincides with the date of your price list.
Step #3: Compare approximately 10 to 20 prescription claims against the price list to confirm contract agreement. It’s impractical to verify all claims, but 10 is a sample size large enough to extract some good assumptions.
Step #4: Now take it one step further. Check what your organization has paid, for prescription drugs, against our pharmacy cost then determine if a problem exists. When there is a 5% or more price differential (paid versus actual cost) we consider this a problem.
Multiple price differential discoveries means that your organization or client is likely overpaying. REPEAT these steps once per month.
— Tip —
Always include a semi-annual market check in your PBM contract language. Market checks provide each payer the ability, during the contract, to determine if better pricing is available in the marketplace compared to what the client is currently receiving.
When better pricing is discovered the contract language should stipulate the client be indemnified. Do not allow the PBM to limit the market check language to a similar size client, benefit design and/or drug utilization. In this case, the market check language is effectually meaningless.
Note: Prices listed herein are gross thus do not account for rebates, discounts or other purchase incentives which ultimately reduces the net cost.
Insulin costs are way up, but drugmakers say PBMs are collecting the loot
 |
| [Click to Enlarge] |
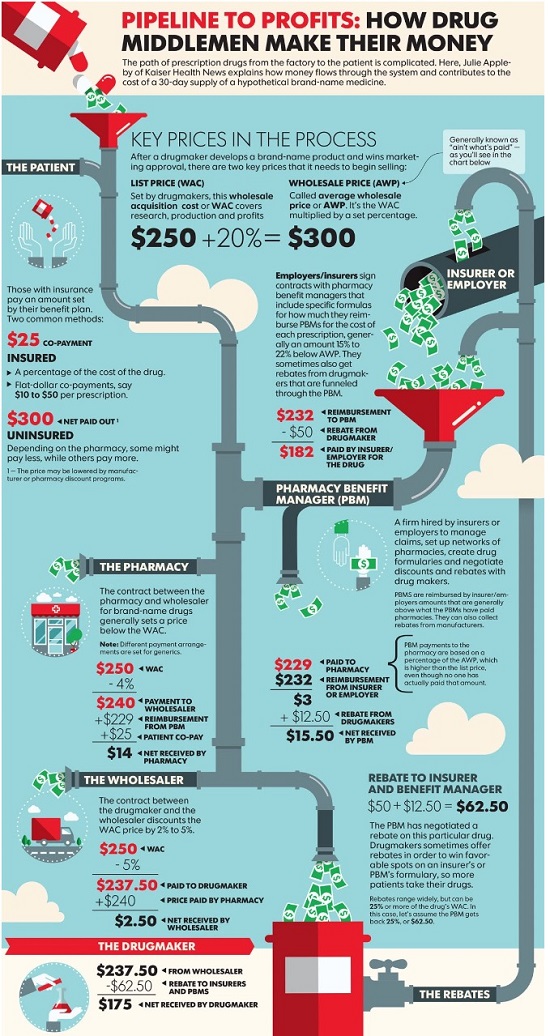
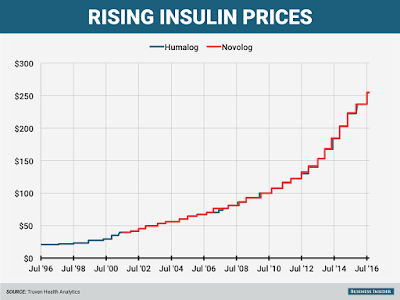
Targeted by critics complaining of big increases in the cost of insulin, pharma’s pointing the finger at pharmacy benefits managers, which are demanding larger rebates in return for access to their covered patients. It’s those demands that are pushing drugmakers to raise their list prices, Enrique Conterno, president of Eli Lilly’s diabetes business, told The Wall Street Journal.
Take Lilly’s long-successful insulin Humalog, for one. Its list price currently sits at $254.80 per vial, more than double its list price in 2011. But with rebates and discounts factored in, Lilly nets less in Humalog sales now than it did in 2009, Conterno said.
The Indianapolis drugmaker’s competitors–Lantus-maker Sanofi and Novo Nordisk–are feeling the pain, too. Both have already warned investors that falling net prices in the U.S. would hurt profits going forward; the average U.S. net price for Lantus is set to fall 10% this year after tanking by 17% last year, the WSJ notes, citing Bernstein estimates. And that’s after a list-price jump to $248.51 per vial from $114.15 in 2011.
The bigger problem? Thanks to a fragmented health insurance system, uninsured patients and those with certain healthcare plans are bearing part, if not all, of the increases themselves.
“There are more patients under high-deductible health plans and who may have a greater copay and coinsurance, and they’re being exposed to a larger share of the prices as well,” Harvard Medical School professor Aaron Kesselheim told the newspaper.
As the diabetes space continues to heat up, many industry watchers expect to see PBM formulary management tactics continue. They’ve already taken a serious toll on drugmakers in other spaces, too–such as hepatitis C and respiratory, where high prices and a wealth of competition have made payers aggressive about negotiating discounts.
But as vocal pharma pricing critic Steve Miller, CMO at leading PBM Express Scripts, told the Journal, his company is all for keeping net prices low despite the discount. “We never tell pharmaceutical companies we want high sticker prices. We want a low net price,” he said.
Tyrone’s comment: Every PBM wants a low net price. The difference though between traditional (any non-fiduciary PBM) and fiduciary PBMs is the extent from which payers benefit from the low “net” price acquired by their PBM. In a fiduciary arrangement, it’s 100% benefit and in all others it’s a crapshoot. Consider this, any PBM that generates cash flow from ingredient costs and/or earned manufacturer revenue (rebates) increases their clients’ net plan costs. So while I agree with Dr. Miller’s point, it is somewhat misleading.
He did, however, acknowledge that “certain patients get caught in the middle of this, and we have got to figure out how to put guard rails around that.” Setting a maximum pharmacy price could be one such guard rail, he said.
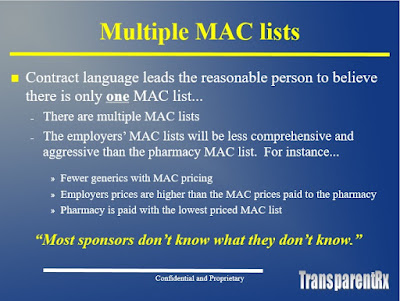
One slide from my “don’t miss” webinar Tuesday October 11 at 3:30 PM ET
 |
| Click to Enlarge |
How many businesses do you know want to cut their revenues in half? That’s why traditional PBMs don’t offer a fiduciary standard and instead opt for hidden cash flow opportunities such as multiple MAC lists. Want to learn more?
Register: https://attendee.gototraining.com/rt/3034343502849349634
A snapshot of what you will learn in this 30 minute webinar:
- Hidden Cash flows in the PBM Industry i.e. formulary steering and rebate disguising
- How to calculate cost of pharmacy benefit manager services or CPBMS
- Specialty pharmacy cost-containment strategies
- The financial impact of actual acquisition cost (AAC) and effective acquisition cost (EAC)
Sincerely,
Tyrone D. Squires, MBA
TransparentRx
2850 W Horizon Ridge Pkwy., Suite 200
Henderson, NV 89052
866-499-1940 Ext. 201
P.S. Yes, it’s recorded. I know you’re busy … so register now and we’ll send you the link to the session recording as soon as it’s ready.
“Gross” Invoice Cost for Top Selling Generic and Brand Prescription Drugs – Volume 138
The costs shared below are what the pharmacy actually pays; not AWP, MAC or WAC. The bottom line; payers must have access to “reference pricing.” Apply this knowledge to hold PBMs accountable and lower plan expenditures for stakeholders.
Step #1: Obtain a price list for generic prescription drugs from your broker, TPA, ASO or PBM every month.
Step #2: In addition, request an electronic copy of all your prescription transactions (claims) for the billing cycle which coincides with the date of your price list.
Step #3: Compare approximately 10 to 20 prescription claims against the price list to confirm contract agreement. It’s impractical to verify all claims, but 10 is a sample size large enough to extract some good assumptions.
Step #4: Now take it one step further. Check what your organization has paid, for prescription drugs, against our pharmacy cost then determine if a problem exists. When there is a 5% or more price differential (paid versus actual cost) we consider this a problem.
Multiple price differential discoveries means that your organization or client is likely overpaying. REPEAT these steps once per month.
— Tip —
Always include a semi-annual market check in your PBM contract language. Market checks provide each payer the ability, during the contract, to determine if better pricing is available in the marketplace compared to what the client is currently receiving.
When better pricing is discovered the contract language should stipulate the client be indemnified. Do not allow the PBM to limit the market check language to a similar size client, benefit design and/or drug utilization. In this case, the market check language is effectually meaningless.
Note: Prices listed herein are gross thus do not account for rebates, discounts or other purchase incentives which ultimately reduces the net cost.
- Go to the previous page
- 1
- …
- 96
- 97
- 98
- 99
- 100
- 101
- 102
- …
- 138
- Go to the next page

