As the simmering feud between Anthem, Inc. and Express Scripts Holding Co. looks to finally have an end date, it’s anyone’s guess as to how the PBM industry will look when the dust settles. Evercore ISI, however, offered some potential outcomes during a May 24 webinar.
During the webinar, titled “The Anthem/Express Saga + The End Game,” analyst Ross Muken observed that “the PBM industry, as well as other parts of health care services, is going through some pretty massive change.” Over the next 24 to 36 months, “we think…you’re going to see a real reshaping of that health care service landscape.”
The dispute between Anthem and Express Scripts “really re-elevated this idea of…the future of the PBM and what does the function look like, what is the economic model?” Muken pointed to the 2007 CVS Corp. purchase of Caremark Rx, Inc. as the beginning of the shift on the PBM side, followed by Express Scripts, Inc.’s deal for Medco Health Solutions, Inc. in 2012 and then UnitedHealthcare’s acquisition of Catamaran Corp. three years later.
“The industry’s been changing for some time, but I do think we’re kind of building up to another series of events where we see other models formed that look quite different than how the industry focused in the past,” he asserted.
These market shifts and merger-and-acquisition activity have led insurers to consider what services should be insourced — a “high-value function that you need to own” — and which should be outsourced. Payers also are looking to the integrated approach that United has with OptumRx and the potential of that model.
Muken said the choices Humana Inc. and Anthem make as far as their PBM services should “have pretty broad implications” and give “a much clearer picture of some of the other tie-ups or strategic relationships that are likely to happen.…Essentially you’ll have an environment whereby a number of vertically integrated entities will have a cost advantage that will drive share, and then those who are left as sort of stand-alone will struggle and probably cede share.”
Still, he cautioned, there are “tons” of potential industry outcomes. The Anthem-Express Scripts relationship began with Express Scripts’ purchase of then WellPoint’s PBM, Next-Rx, in 2009. As part of the deal, Express Scripts gained a 10-year contract to provide PBM services to WellPoint’s clients.
In 2012, Anthem conducted a price check to ensure it was getting “competitive benchmark pricing.” Until the 2016 J.P. Morgan & Co. conference where Anthem took the companies’ dispute public — the “J.P. Morgan pipe bomb,” Muken called it — “this was viewed as a deal that was reasonably constructed on both sides.”
According to Muken, “In our minds, this definition of the competitive pricing benchmark is really, I think, at the epicenter of what some of these guys are debating.”
“What’s driving a lot of this” focus on the future of the PBM “is a view on how managed care wants to manage the drug benefit going forward,” said analyst Mike Newshel during the call. Managed care “wants to have a more integrated benefit between medical and pharmacy” so plans can manage them together.
Anthem has issued an RFP for its PBM business — “the endgame for Anthem is getting a more competitive cost structure,” Newshel said. Express Scripts has said it is unlikely to retain that business — Evercore gives this option a 5% chance of happening. Other potential moves are Anthem shifting its business to OptumRx (a 15% probability) or to CVS (a 30% probability).
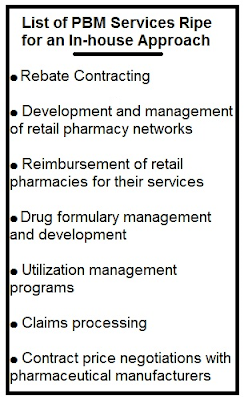
But the most likely move (a 50% probability) is an à la carte approach — “separating the PBM functions into discrete things that they can pick and choose from” — through which Anthem will outsource various functions to various vendors — perhaps Walgreens Boots Alliance, Prime Therapeutics LLC and software provider Argus — while keeping several high-value functions to itself, said Newshel.
This hybrid model that is a “mix of insourcing and outsourcing” is not a totally new concept, he noted, and is an interesting way to get to a good price point. He maintained that Anthem has the potential to get to $4 billion or $5 billion in total drug savings.
[Source]