PBM Formulary Management Tips: Three That Are Meaningful [Rerun]

Claims repricings are an integral part of what a growing fiduciary-model PBM does daily. I happen to believe that plan sponsors and their advisors rely too heavily on them. In fact, I wrote recently, “each time a non-fiduciary PBM gets caught with its hand in the cookie jar you can’t go beyond the first sentence of the obfuscation without the word CONTRACT being thrown around. Yet, when you ask self-funded employers or their advisors what’s most important to them when evaluating PBM proposals you get CLAIMS REPRICING. PBM contract nomenclature sets the foundation for all the financials. A 400 question RFP might make you feel better, but it doesn’t deliver results or in this case radical transparency. PBM literacy, on the other hand, delivers results. PBM transparency is best determined by a trained eye. When the PBM operates with radical transparency, you CANNOT overpay. The same cannot be said for even the most aggressive claims repricing or rebate guarantees unaccompanied by a fiduciary standard of care and/or radical transparency.” It was written in response to the Louisiana Attorney General’s recent lawsuit against a large PBM. Keep reading for the three meaningful PBM formulary management tips to take advantage of so not to be taken advantage of.

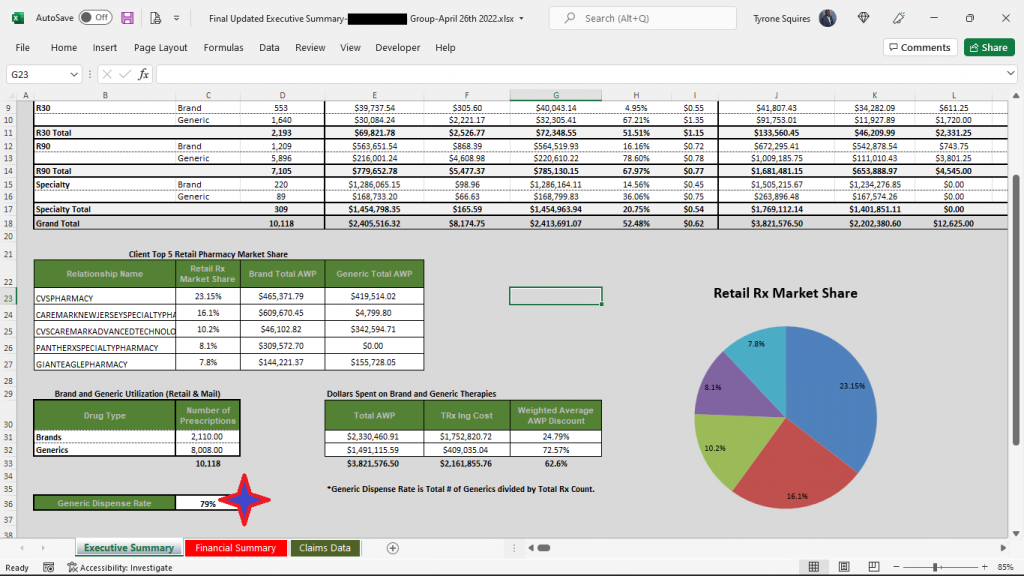
Even though I’m not a huge fan of claims repricings, I am intrigued by the process and results. For example, in the results below (figure 1) you will see that TransparentRx’s price difference alone isn’t enough to warrant a PBM vendor change. This always concerns me as most plan sponsors don’t look beyond the claims repricing results. It isn’t until you look at the incumbent PBM’s clinical performance (product mix and utilization) that there is a problem big enough to consider that something must change. Formulary management is a clinical service. The Generic Dispense Rate or GDR is only 79%. Fortunately for us our book performance is in line with the national GDR average of 90%! Furthermore, for every 1% increase in GDR a self-insured employer can expect to reduce drug costs by 2.5%. This employer was leaving $650,000 annually on the table all because of poor clinical oversight. More specifically, drug utilization management processes were rubberstamped, and the formulary managed inefficiently. Here are three PBM formulary management tips to take advantage of so not to be taken advantage of.

  • Don’t give up cost control to make participants happy. At the beginning of the pandemic employers, at the behest of PBMs, decided to open the flood gates for prescription drugs. They removed safety nets such as refill too soon, quantity limits and step therapy. The only entities to benefit were the PBMs themselves as volume increased significantly. Worse yet, some of these plans have not yet reverted to pre-pandemic drug utilization management protocols. Proper pharmacy benefits management practices call for safety and efficiency first no matter the circumstances. Critics, prescribers and patients, view cost control as impeding on what’s best for them. We “had” a client who insisted their employee be allowed to have a brand drug dispensed for $2000 although the generic drug would have cost less than $200. There was no clinical reason only that the employee didn’t want to take a generic. If it were going to cost you money or put employees in danger, you wouldn’t change your manufacturing processes just to make an employee happy. So why do it in your employer-sponsored pharmacy benefits program?
  • Treat formularies as a cost-containment tool not a recruiting tool. Price is the most common driver of pharmacy costs. Drug pricing takes into consideration AWP discounts, inflation, and rebates, for example. Cost share is the second driver of pharmacy cost HR and finance are most familiar. Cost sharing consists of coinsurance, copays and more recently accumulator and maximization programs. However, there are two big drivers of pharmacy cost that often get overlooked and they are utilization and product mix. Since I’ve already addressed product mix let’s look at utilization. Formularies are often used in conjunction with drug utilization management tools such as refill too soon, step therapy, quantity limits, dose optimization, prior authorization, or pill splitting, for example. An efficient combination of benefit design, utilization and product mix offers the best of both worlds; maximization of participant choice while simultaneously helping to reduce final plan drug costs. If you want to learn more about plan design, formulary, or utilization management techniques, join our next Certified Pharmacy Benefits Specialist class.
  • Opt for a closed formulary. As an employer myself, it just never made sense to me that my peers say, “here is my checkbook have at it.” The fundamentals which allowed the business to grow are somehow lost after the business becomes successful. As a side, Carl Icahn’s documentary “The Restless Billionaire” is fascinating. Check it out if you haven’t already. He talks a lot about wasteful spending. In pharmacy benefit plans, thousands of dollars are paid for drugs when a $100 generic drug would provide similar clinical benefits. Worse yet, millions of dollars are spent on drugs with no clinical benefit. An open formulary is a list of medications which has no limitation to access to a medication by a practitioner. A closed formulary on the other hand, is a list of medications (formulary) which limits access of a practitioner to some medications. The truth is efficiency (cost control and clinical outcomes), and participant satisfaction are exceedingly difficult if not impossible to separate. The path to clinical success in pharmacy benefits management gets clearer with a closed formulary.

PBM Formulary Management Tips: Three That Are Meaningful, Conclusion

Unless it has contractually agreed to contain your costs, do not leave the responsibility of formulary management solely in the hands of the PBM. When rebates are involved, the formulary could become a tool for favoring drugs from preferred manufacturers instead of a tool to maximize clinical benefit.

6 Payor Tactics to Control Drug Spending [Weekly Roundup]

6 Payor Tactics to Control Drug Spending and other notes from around the interweb:

  • 6 Payor Tactics to Control Drug Spending. Pressure is building to shift to the medical benefit. Plans didn’t historically manage drugs on the medical benefit as strictly as the pharmacy benefit, but now there is increasing economic pressure to do so, Dr. Grant said. Payor strategies here include aggressive site-of-care optimization strategies directing patients to the most cost-effective location to receive medications, and requiring billing through specialty pharmacies, known as bagging strategies, where health systems and physician practices must accept bagged medications from pharmacies to administer to patients. The best option is gold bagging, in which a specialty pharmacy dispenses prescriptions to its own clinics for administration, she said. Some states and professional groups, such as the American Hospital Association, have banned or oppose bagging for its potential disruptions in care.
  • PBMs pocketing savings from generic prescriptions, report says. The new report adds to a growing body of evidence showing that consumers overpay for generics, as “pharmacy benefit managers game opaque and arcane pricing practices to pad profits,” the white paper said. Generics make up more than 90% of prescriptions in the U.S. but just 18% of drug spending. By one estimate, the use of generic and biosimilar drugs in place of their branded equivalents saved the healthcare system $338 billion in 2020 alone. However, despite generics driving down prices relative to branded drugs, consumers are not benefiting from savings, the white paper said. “Generics are overlooked when we talk about drug pricing issues in this country,” said Erin Trish, co-director of the USC Schaeffer Center, in a statement. “But the same lack of transparency that is causing outrage over high and rising spending on branded drugs is also creating issues in the generic drug space.”
  • How Pharmacy Benefit Managers (PBM) Make Money – PBM Accountability Project. PBMs derive much of their revenue from collecting a range of service fees and other charges from manufacturers, pharmacies, and other supply chain entities, ultimately driving up the cost of the prescription drugs. A new study by the PBM Accountability project shines a light on the PBM business model, often described as a “black box,” revealing the sources of growth in PBM gross profit between 2017 and 2019.
  • Federal Trade Commission opens investigation into pharmacy benefit managers. The FTC will send orders to CVS Caremark, Express Scripts Inc., OptumRx Inc., Humana Inc., Prime Therapeutics LLC and MedImpact Healthcare Systems Inc. and will examine the “impact of vertically integrated pharmacy benefit managers on the affordability and accessibility of prescription drugs,” the agency said. According to the release, the inquiry will aim to closely investigate the role of pharmacy benefit managers in the U.S. pharmaceutical system, which may entail financial and policy involvement with drug manufacturers, health insurance companies and pharmacies. These functions are often clouded by “complicated, opaque contractual relationships that are difficult or impossible to understand for patients and independent businesses across the prescription drug system,” the release said.

Reference Pricing: “Gross” Invoice Cost vs. AWP for Popular Generic and Brand Prescription Drugs (Volume 415)

This document is updated weekly, but why is it important? Healthcare marketers are aggressively pursuing new revenue streams to augment lower reimbursements provided under PPACA. Prescription drugs, particularly specialty, are key drivers in the growth strategies of PBMs, TPAs, and MCOs pursuant to health care reform.

How to Determine if Your Company [or Client] is Overpaying

Step #1:  Obtain a price list for generic prescription drugs from your broker, TPA, ASO or PBM every month.

Step #2:  In addition, request an electronic copy of all your prescription transactions (claims) for the billing cycle which coincides with the date of your price list.

Step #3:  Compare approximately 10 to 20 prescription claims against the price list to confirm contract agreement. It’s impractical to verify all claims, but 10 is a sample size large enough to extract some good assumptions.

Step #4:  Now take it one step further. Check what your organization has paid, for prescription drugs, against our acquisition costs then determine if a problem exists. When there is more than a 5% price differential for brand drugs or 25% (paid versus actual cost) for generic drugs we consider this a potential problem thus further investigation is warranted.

Multiple price differential discoveries mean that your organization or client is likely overpaying. REPEAT these steps once per month.

— Tip —

Always include a semi-annual market check in your PBM contract language. Market checks provide each payer the ability, during the contract, to determine if better pricing is available in the marketplace compared to what the client is currently receiving.

Benefits of Working with a Fiduciary Model PBM [Free Webinar]

The benefits of working with a fiduciary model PBM (pharmacy benefit manager) are far reaching. Commercial and public sector employers, unions, health plans, and health systems are demanding radical transparency, self-governance, and overall plan performance. Yet, 90% fall short of those lofty goals. Although it’s a widely used term across PBMs, only a handful are truly pass-through or transparent — and even fewer are fiduciary. If your PBM isn’t, chances are you’re overpaying. Education is the key to reducing skyrocketing pharmacy costs.

Money is Good, Information is Better:
Benefits of Working with a Fiduciary Model PBM

Benefits of Working with a Fiduciary Model PBM

“Just wanted to share that this was one of the best, in-depth, presentations I’ve seen on Rx. I’ve been in the business 35 years and that’s not an easy feat to impress me! Well done…”

Frank H. Kohn, CHC
High Value Strategic Advisors

A snapshot of what you will learn during this 45-minute webinar:

  • How PBMs make money
  • Strategies to significantly reduce costs and improve member health
  • Contract terms—the need for solid terms in a contract
  • The most important metric when evaluating PBM performance
  • Upon registration your receive a case study for a real-life example of a client slashing Rx costs by 54%

See you Wednesday, 06/15/2022 at 2 PM EDT!

6 Payor Tactics to Control Drug Spending [Weekly Roundup]

6 Payor Tactics to Control Drug Spending and other notes from around the interweb:

  • 6 Payor Tactics to Control Drug Spending. Pressure is building to shift to the medical benefit. Plans didn’t historically manage drugs on the medical benefit as strictly as the pharmacy benefit, but now there is increasing economic pressure to do so, Dr. Grant said. Payor strategies here include aggressive site-of-care optimization strategies directing patients to the most cost-effective location to receive medications, and requiring billing through specialty pharmacies, known as bagging strategies, where health systems and physician practices must accept bagged medications from pharmacies to administer to patients. The best option is gold bagging, in which a specialty pharmacy dispenses prescriptions to its own clinics for administration, she said. Some states and professional groups, such as the American Hospital Association, have banned or oppose bagging for its potential disruptions in care.
  • Federal Trade Commission and Congress Want to Rein in PBMs – Forbes. Both the Federal Trade Commission (FTC) and Congress want to rein in pharmacy benefit managers (PBMs), as they focus on alleged anti-competitive practices which hinder a properly functioning prescription drug market. Maybe this time a full-fledged inquiry and legislative action will happen, given that there’s considerable bipartisan support. Given the dominant role PBMs play – they’re involved in 90% of prescriptions in the U.S. to one degree or another – they’re able to exert significant control over payment rates to pharmacies, but also patients’ access to medicines and their cost-sharing. FTC Chair Lina Khan has reiterated her desire to have the agency examine possible anti-competitive practices in the PBM industry. This includes spread pricing. Here, PBMs charge an employer or health plan more than they reimburse a pharmacy for a prescription drug and pocket the difference as profit.
  • How Pharmacy Benefit Managers (PBM) Make Money – PBM Accountability Project. PBMs derive much of their revenue from collecting a range of service fees and other charges from manufacturers, pharmacies, and other supply chain entities, ultimately driving up the cost of the prescription drugs. A new study by the PBM Accountability project shines a light on the PBM business model, often described as a “black box,” revealing the sources of growth in PBM gross profit between 2017 and 2019.
  • $350 Billion in Health Care Rebates Go to Middlemen. In 2021, my company, Sanofi, paid more than $14 billion – about 50 cents of every dollar we earned on our medicines – in discounts and rebates to these middlemen with the purpose of ensuring patients can get the medicines they need at the lowest possible price. We’ve been transparent with this data for several years and updated it in our just released annual Pricing Principles report. Across the entire industry, the figure that was paid by manufacturers in 2021 in rebates and discounts was $350 billion. That’s more money than the NFL made, in total, over the course of Tom Brady’s 22-year career.

Reference Pricing: “Gross” Invoice Cost vs. AWP for Popular Generic and Brand Prescription Drugs (Volume 414)

This document is updated weekly, but why is it important? Healthcare marketers are aggressively pursuing new revenue streams to augment lower reimbursements provided under PPACA. Prescription drugs, particularly specialty, are key drivers in the growth strategies of PBMs, TPAs, and MCOs pursuant to health care reform.

How to Determine if Your Company [or Client] is Overpaying

Step #1:  Obtain a price list for generic prescription drugs from your broker, TPA, ASO or PBM every month.

Step #2:  In addition, request an electronic copy of all your prescription transactions (claims) for the billing cycle which coincides with the date of your price list.

Step #3:  Compare approximately 10 to 20 prescription claims against the price list to confirm contract agreement. It’s impractical to verify all claims, but 10 is a sample size large enough to extract some good assumptions.

Step #4:  Now take it one step further. Check what your organization has paid, for prescription drugs, against our acquisition costs then determine if a problem exists. When there is more than a 5% price differential for brand drugs or 25% (paid versus actual cost) for generic drugs we consider this a potential problem thus further investigation is warranted.

Multiple price differential discoveries mean that your organization or client is likely overpaying. REPEAT these steps once per month.

— Tip —

Always include a semi-annual market check in your PBM contract language. Market checks provide each payer the ability, during the contract, to determine if better pricing is available in the marketplace compared to what the client is currently receiving.

How Pharmacy Benefit Managers Make Money and What to Do About It [Free Webinar]

Because plan sponsors don’t know how to calculate how much money PBMs make, it gives PBMs all the incentive they need to overcharge. How many businesses do you know want to cut their revenues in half? That’s why traditional pharmacy benefit managers, and their stakeholders, don’t offer a fiduciary standard of care and instead opt for hidden cash flow opportunities to generate their service fees. Want to learn more?

Here is what some participants have said about the webinar.

“Thank you, Tyrone. Nice job, good information.” David Stoots, AVP

“Thank you! Awesome presentation.” Mallory Nelson, PharmD

“Thank you, Tyrone, for this informative meeting.” David Wachtel, VP

“…Great presentation! I had our two partners at the presentation as well. Very informative.” Nolan Waterfall, Agent/Benefits Specialist

A snapshot of what you will learn during this 30-minute webinar:

  • Hidden cash flows in the PBM Industry
  • Basic to intermediate level PBM terminologies
  • Specialty pharmacy cost-containment strategies
  • Examples of drugs that you might be covering that are costing you
  • The #1 metric to measure when evaluating PBM proposals

Understanding how pharmacy benefit managers make money and how much you pay them for their services is a key element in running an efficient pharmacy benefits program. Join us to learn more.

See you Tuesday, 06/14/22 at 2 PM ET!

Sincerely,
TransparentRx
Tyrone D. Squires, CPBS  
10845 Griffith Peak Drive, Suite 200  
Las Vegas, NV 89135 
Office: (866) 499-1940
Mobile: (702) 803-4154

P.S. Yes, it’s recorded. I know you’re busy … so register now and we’ll send you the link to the session recording as soon as it’s ready. 

Anti-competitive PBM Practices Harming Patients, Payers, and Pharmacies, APCI Tells FTC [Weekly Roundup]

Anti-competitive PBM Practices Harming Patients, Payers, and Pharmacies, APCI Tells FTC and other notes from around the interweb:

  • Federal Judge Strikes Down CMS’ Medicaid Copay Rule, Handing Drugmakers Major Win. In 2021, the pivot to biosimilar preference was significant and rapid. Beyond the increased numbers of new biosimilar approvals and launches, important new biosimilars were approved, and use of biosimilars increased in 2021, beginning with the FDA decisions to give interchangeability designations to two biosimilars. The interchangeable designation speeds up access by allowing pharmacies to dispense biosimilars in place of “originators” — the brand-name products that the biosimilars are copies of — without physician consent. Interchangeable status was granted for biosimilars of Lantus (insulin glargine) and Humira (adalimumab), although the Humira biosimilars won’t be on the market till next year.
  • Anti-competitive PBM Practices Harming Patients, Payers, and Pharmacies, APCI Tells FTC. In addition to urging the FTC to act against PBMs in its comments, APCI also included a laundry list of examples of commonly used PBM practices that are harmful to patients, taxpayers, and small businesses. The co-op detailed practices such as drug coverage decisions that force patients to obtain far more expensive brand-name medications when cheaper generic medications are available; utilizing secretive reimbursement methods that inflate prescription drug prices; and steering patients to PBM owned/affiliated mail order pharmacies, specialty pharmacies, and retail pharmacies.
  • CMS Finalizes Changes to Pharmacy DIR in Part D Starting with Contract Year 2024. Changes in the final rule mean that pharmacies will be able to see, at the point of sale, the “lowest possible reimbursement” for a Part D drug, which will now reflect any pharmacy price concession in that value. CMS states the final rule is a win for patients who will see lower out-of-pocket costs at the pharmacy, which it estimates to save patients over $26 billion between 2024 and 2032. Some pharmacy advocates also claim the final rule is an important step to bring transparency to pharmacy negotiated prices.
  • $350 Billion in Health Care Rebates Go to Middlemen. In 2021, my company, Sanofi, paid more than $14 billion – about 50 cents of every dollar we earned on our medicines – in discounts and rebates to these middlemen with the purpose of ensuring patients can get the medicines they need at the lowest possible price. We’ve been transparent with this data for several years and updated it in our just released annual Pricing Principles report. Across the entire industry, the figure that was paid by manufacturers in 2021 in rebates and discounts was $350 billion. That’s more money than the NFL made, in total, over the course of Tom Brady’s 22-year career.

Reference Pricing: “Gross” Invoice Cost vs. AWP for Popular Generic and Brand Prescription Drugs (Volume 413)

This document is updated weekly, but why is it important? Healthcare marketers are aggressively pursuing new revenue streams to augment lower reimbursements provided under PPACA. Prescription drugs, particularly specialty, are key drivers in the growth strategies of PBMs, TPAs, and MCOs pursuant to health care reform.

How to Determine if Your Company [or Client] is Overpaying

Step #1:  Obtain a price list for generic prescription drugs from your broker, TPA, ASO or PBM every month.

Step #2:  In addition, request an electronic copy of all your prescription transactions (claims) for the billing cycle which coincides with the date of your price list.

Step #3:  Compare approximately 10 to 20 prescription claims against the price list to confirm contract agreement. It’s impractical to verify all claims, but 10 is a sample size large enough to extract some good assumptions.

Step #4:  Now take it one step further. Check what your organization has paid, for prescription drugs, against our acquisition costs then determine if a problem exists. When there is more than a 5% price differential for brand drugs or 25% (paid versus actual cost) for generic drugs we consider this a potential problem thus further investigation is warranted.

Multiple price differential discoveries mean that your organization or client is likely overpaying. REPEAT these steps once per month.

— Tip —

Always include a semi-annual market check in your PBM contract language. Market checks provide each payer the ability, during the contract, to determine if better pricing is available in the marketplace compared to what the client is currently receiving.

6 PBM Performance Metrics to Hang Your Hat On

Idioms like “hang your hat on” come in handy when you write or talk a lot. One of my other favorites is talk is cheap. Having the right information, however, is invaluable when you know how to interpret it and then create a plan. Where pharmacy benefits are concerned, look no further than these 6 PBM performance metrics for your competitive advantage.

In her book, Competitive Intelligence Advantage, Seena Sharp wrote, “Companies often downplay intelligence, believing their competitors to have access to the same information. Well, everyone also has access to a wide array of fruits and vegetables, yet many don’t eat them or eat very few. Access does not translate into action. Your competitive advantage includes executing good analysis of the right information and then figuring out what all of this means for your company…Those who seize the opportunity and develop an effective plan that can be accomplished have a significant competitive advantage.”

  1. BER (Brand Effective Rate) means the average percent discount off the AWP for all brand drugs (as determined by a price reporting service such as Medispan) for each reporting period i.e. monthly, quarterly etc. Break out by channel i.e. retail 30, specialty etc. and don’t permit any cost offsets. Cost offsets permit performance overages in one channel to be added to underperformance in a different channel. Goal > 18%.
  1. GER (Generic Effective Rate) is the average percent discount off the AWP for all generic drugs whether reimbursed at MAC, usual and customary pricing, or AWP discount. Because nine out of ten dispensed drugs are generic, the GDR performance metric is especially important. It can be difficult to catch where you are losing money until it is too late. You want to catch overpayments early enough to make the proper adjustment(s). Continuously monitor your GER so any overpayments to PBMs don’t pile up. Analyze performance by channel i.e. retail 30, retail 90 etc. Goal > 88%.
  1. GDR (Generic Dispense Rate) or generic dispensing ratio is the number of generic fills divided by the total number of prescriptions. GDR is a standard performance metric on which our formulary managers are regularly evaluated. For every 1% increase in GDR a plan can expect to realize a 2.5% reduction in gross drug spend. Both GDR and GSR are indicators of how well clinical programs are performing. For example, loose utilization management will produce a low GDR. Goal > 90%.
  1. GSR (Generic Substitution Rate) is the rate at which generic drugs are dispensed in place of their brand equivalents. To calculate GSR, divide the number of generic drug prescriptions by the total of all multisource prescriptions (both generic and multisource brand). Goal > 97.5%.
  1. MER (MAC Effective Rate) is the average percent discount off the AWP for drugs processed by the MAC list to be applied to your organization. MAC lists are proprietary to each PBM, so MAC’d drugs and their corresponding prices are set by PBMs. MAC or maximum allowable cost is used to establish an upper limit the PBM will reimburse a pharmacy and subsequently bill its clients for branded drugs and their multi-source and authorized generics. Non-fiduciary PBMs can have multiple MAC lists. For brokers and consultants, MER is an excellent way to compare how MAC lists perform for multiple pharmacy benefit managers. Goal > 90%.
  1. PMPM (Per Member Per Month) is the most fundamental cost indicator for financial benchmarking in pharmacy benefits. As such, every proposal should include a projected PMPM. Additionally, incumbent PBM cost performance should be measured by change in PMPM YOY for both whole dollars and percentage. It is calculated by dividing the total annual cost or revenue by the number of member months. Goal < $100 PMPM. 

Conclusion – 6 PBM performance metrics

Each goal provided above assumes clean claims. In other words, all claims are included and there are no reclassifications of any drugs. When running a comparative PBM analysis, make sure you are comparing apples to apples. PBMs are notorious for reclassifying drugs, reducing claim counts and other tricks to make their numbers look better than how they performed. The Pharmacy Benefit Manager Transparency Act of 2022 could very well be the first stage of failure for bad actors. It targets the profits of non-fiduciary pharmacy benefit managers. Is this game over?