Solutions for Reducing Patient Cost Sharing for Prescription Medications

In 2010, Fletcher was diagnosed with chronic lymphocytic leukemia. Within 6 months of starting treatment, his disease was in remission. But this good news did not last as he relapsed just 9 months later. He began treatment again, but the results were poor: Fletcher developed congested lungs, a persistent cough, and cataracts that left him temporarily blind. So, his doctor proposed a different treatment. Exhausted, but hopeful, Fletcher was ready to try the new drug until he heard what it would cost him—$2310 out of pocket (OOP) for just one month of treatment. His best chance of survival would consume nearly his entire month’s take-home pay.

It was not long before Jody’s medical bills ate through her family’s savings following her diagnosis with acute lymphoblastic leukemia in 2009. To keep her cancer in remission, Jody is taking a kinase inhibitor that she will likely need for the rest of her life. But when she went to pick up her first dose at the pharmacy, she, too, was shocked to learn how much that lifesaving drug would cost her —$5640 for the first month alone.

Everything that she and her husband had put away for their children’s college educations has gone to keeping Jody alive. Besides leukemia, Fletcher and Jody have something in common: they have had health insurance throughout their cancer treatment journey. Yet, because of the high cost sharing associated with their medications, Fletcher and Jody have faced profound difficulty accessing the treatments prescribed for them.

THE IMPACT OF THE RISING COST OF TREATMENT ON PATIENTS

Figure 1

Over the last decade, employers and other providers of health insurance have shifted more costs onto patients due to a multitude of factors that includes the rising cost of healthcare services. This trend is especially troubling for patients living with a blood cancer diagnosis, since available treatments typically consist of high-priced specialty drugs and other cost-intensive healthcare services. A common discussion with this cost-shifting trend is the steady increase in consumer premium payments, as employee premium contributions have increased 83% since 2006 (compared with a 54% increase for employers over the same period).

Although premium increases have captured the headlines in recent years, the rising OOP costs that patients face, after they pay their premiums, have proven to be even more dramatic (FIGURE 1). In 2003, almost half of patients in employer-provided insurance had no deductible to cover. Ten years later, less than 20% of patients had the same benefit. In fact, as insurers have recognized that increasing deductibles can discourage consumers from accessing their benefits, plans have accelerated this trend. In 2015, the average deductible in an employer-provided insurance plan had increased more than 250% from a decade earlier—increasing 3-times faster than premiums over the same period.

Of specific concern to blood cancer patients are benefit designs that increase the portion of drug costs borne by consumers. This trend is particularly striking in the Medicare Part D marketplace—in 2015, every stand-alone prescription drug plan had adopted a “specialty tier.” Placing a drug in a specialty tier allows the plan to charge patients a percentage of a drug’s list price rather than a fixed dollar amount and simultaneously prevents a patient from accessing Medicare’s cost-sharing appeals process. The impact on affordability is reflected in increases in the number of medications placed on the specialty tier each year.

In the past 4 years alone, Part D plans have shifted 50% more drugs onto their specialty tiers,3 subjecting many patients relying on those medications to thousands of dollars in additional cost sharing. Every day, across the country, blood cancer patients face decisions that pit their health against their family’s finances. And while policy makers, payers, and drug manufacturers engage in debates on drug pricing and a host of related topics— debates that seem far from reaching a productive resolution— patients, like Fletcher and Jody, struggle day to day to access critical medications.

Evidence indicates that once cost sharing exceeds $100, adherence to prescribed medications begins to drop off significantly likely due to the trade-off between paying for medical care and the prospect of damaging the family’s financial stability. Data also show that decreases in adherence correspond to worse outcomes and increases in costly medical interventions that, in many cases, could have been avoided with proper adherence. It is unacceptable and tragic when a patient knows that a potential cure is waiting behind the pharmacy counter but cannot receive it due to his/her inability to pay.

Policy makers ought to give priority consideration to solutions that would meet the following criteria:

  • Patients would experience a meaningful improvement in access to care
  • Payers could reasonably implement the proposed solution from both a financial and administrative perspective
  • The proposed solution will not prohibit a health plan from complying with existing laws and regulations, in particular, actuarial value requirements as established by the ACA

CONCLUSION

To be clear, the cost of medication is just 1 cost that blood cancer patients and their families must face. A proactive and multi-faceted approach to addressing cost and access issues for our communities includes:

  1. Working to secure public policies that can reduce the barriers associated with high OOP costs
  2. Conducting research into how cost acts as a barrier for treatment access
  3. Providing assistance through our copay program to help patients who cannot afford their insurance premiums or drug co-pays
  4. Calling on the pharmaceutical and biotechnology industries to share real-world quality of life and outcomes data to support the pricing for their medications.

We are confident that by collaborating with key stakeholders we can dramatically improve patient access to these important therapies.

See more at: http://www.ajmc.com/journals/evidence-based-oncology/2016/august-2016/solutions-for-reducing-patient-cost-sharing-for-medications#sthash.I13GLiu5.dpuf

Should drug prices be tied to patient outcomes?

Global pressure on health spending is forcing the $1 trillion-a-year pharmaceutical industry to look for new ways to price its products: charging based on how much they improve patients’ health, rather than how many pills or vials are sold.

In the United States, both parties are promising fresh action on drug prices whoever wins the White House. In Europe, economies are stalled, squeezing state health budgets. And in China and other Asian markets, governments are getting tougher with suppliers.

Source: AARP Annual Rx Price Trends Report

Pricing drugs based on clinical outcomes is one way to ensure that limited funds bring the most benefits to patients now and pay for the most promising medical advances in future. Some experiments in pricing have already been made. But shifting the overall industry to a new model requires improvements in data collection and a change in thinking, say drug pricing experts.

“Eventually, we are going to get there,” said Kurt Kessler, managing principal at ZS Associates in Zurich, which advises companies on sales and marketing strategies. “But it is a long, tough slog because it’s difficult to get the right data and agree on what the right outcomes are to measure.”

In the past, governments and insurers made room in their budgets for new drugs by switching to cheap generics as patents expired on older drugs. But today generics already account for nearly nine out of every 10 prescriptions in key markets like the United States, and fewer big drugs are going off patent.

That leaves little headroom for pricey new medicines for cancer and other hard-to-treat diseases, even as they come to market in growing numbers. The U.S. Food and Drug Administration has already approved 16 new drugs this year.

Investors got a wake-up call on the issue last Friday when $10 billion was lopped off the market value of Novo Nordisk as the world’s biggest diabetes firm warned of falling U.S. prices.
Pharmacy benefit managers administering U.S. health plans are pushing back hard by excluding some drugs deemed too expensive – including Novo’s – leading to a crunch in areas like diabetes, a disease that now accounts for 12 percent of global healthcare spending.

The Danish group has an unusually high exposure to the U.S. market, but it is not alone in signalling tough times ahead. The chief executives of Novartis, Eli Lilly and GlaxoSmithKline have all warned recently that pricing will become increasingly challenging across the board.

Accounting for 40 percent of global drug sales, the fate of the U.S. market is front and centre in the minds of drug company executives, some of whom privately admit to preparing for a “confrontational” period in relations with politicians.

Read more: Future of Drug Pricing: Paying for Benefits?

Reference Pricing: Invoice Cost (Gross) for Top Selling Generic and Brand Prescription Drugs – Volume 130

This document is updated weekly, but why is it important?  Healthcare marketers are aggressively pursuing new revenue streams to augment lower reimbursements provided under PPACA. Prescription drugs, particularly specialty, are key drivers in the growth strategies of PBMs, TPAs and MCOs pursuant to health care reform. 

The costs shared below are what the pharmacy actually pays; not AWP, MAC or WAC. The bottom line; payers must have access to “reference pricing.” Apply this knowledge to hold PBMs accountable and lower plan expenditures for stakeholders.

How to Determine if Your Company [or Client] is Overpaying


Step #1:  Obtain a price list for generic prescription drugs from your broker, TPA, ASO or PBM every month.


Step #2:  In addition, request an electronic copy of all your prescription transactions (claims) for the billing cycle which coincides with the date of your price list.

Step #3:  Compare approximately 10 to 20 prescription claims against the price list to confirm contract agreement.  It’s impractical to verify all claims, but 10 is a sample size large enough to extract some good assumptions.

Step #4:  Now take it one step further. Check what your organization has paid, for prescription drugs, against our pharmacy cost then determine if a problem exists. When there is a 5% or more price differential (paid versus actual cost) we consider this a problem.

Multiple price differential discoveries means that your organization or client is likely overpaying. REPEAT these steps once per month.

— Tip —

Always include a semi-annual market check in your PBM contract language. Market checks provide each payer the ability, during the contract, to determine if better pricing is available in the marketplace compared to what the client is currently receiving.

When better pricing is discovered the contract language should stipulate the client be indemnified. Do not allow the PBM to limit the market check language to a similar size client, benefit design and/or drug utilization. In this case, the market check language is effectually meaningless.

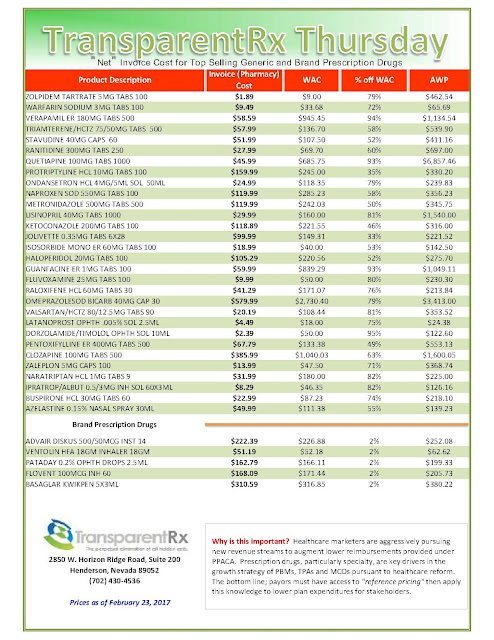
Note: Prices listed herein are gross thus do not account for rebates, discounts or other purchase incentives which ultimately reduces the net cost.

In-Office Dispensing: A Better Value?

Over the last several years, the proliferation of oral cancer drugs has caused many oncology practices to establish in-house pharmacies using either a board of pharmacy or physician’s medical license.

Click to Enlarge

Today, almost half of US community oncology practices have an in-office dispensing (IOD) program, and that number continues to grow. However, due to the burgeoning volume of pricey oral oncolytics coming to market, IODs are now competing with retail pharmacy chains, pharmacy benefit managers (PBMs), and a growing number of independent specialty pharmacies.

With increased competition, the challenge IOD practices now face is to prove the value of what they do. Why should drug manufacturers continue to allow them access to their drugs? Why should health plans and pharmacy benefit managers allow them in their networks? What benefits do IODs offer that other pharmacy channels cannot deliver?

Fortunately, as value-based reimbursement models emerge in the oncology market, including the recently launched Oncology Care Model (OCM) pilot, IODs are well positioned to demonstrate their superiority to other pharmacy channels.

In broad terms, IODs can provide better patient care and outcomes—at lower cost—through a more clinically integrated and streamlined process. It is useful to describe the value IOD brings to physicians, patients, payers, or manufacturers in two ways: having the pharmacy closer to the patient and having the pharmacy closer to the physician.
Benefits of a Pharmacy Closer to the Patient

Having the pharmacy closer to patients allows them greater convenience and improves their overall healthcare experience. Because cancer treatment can be exhausting, patients often do not have the time, energy, or mobility to search for and coordinate with a pharmacy that can fill their prescriptions. It is important to recognize that costly oral oncolytics usually cannot be found at the local pharmacies most patients use regularly.

These drugs are only available through a limited number of pharmacies, which are knowledgeable on specialty medications and equipped with the capabilities to support patients before and after they begin therapy. These pharmacies are often selected by the manufacturer or payer. Consequently, it’s often confusing to patients which pharmacy must be used.

Cancer care for patients can be greatly simplified and better coordinated at a practice with IOD. Using pharmacy management software, staff can help patients determine insurance coverage, complete payer-imposed prior authorizations, and most important, find copay assistance when very expensive therapies are needed.

All of this can be done while the patient is in the clinic receiving other treatment or visiting the oncologist. In addition, the actual dispensing of the drug can be synchronized with other elements of the patient’s regimen, whether it be surgery, radiation, or infusion. These examples of better coordinated care equate to a faster treatment time and greater patient convenience—a shared goal of all healthcare stakeholders.

A common challenge to payers is oral oncolytic drug waste. This waste is usually created because pharmacies will typically fill a 30-day supply that is more than needed because the patient will frequently discontinue or delay therapy for a myriad of reasons, such as intolerance or tumor progression.

See more at: http://www.onclive.com/publications/oncology-business-news/2016/august-2016/inoffice-dispensing-is-better-value#sthash.eInrQ0D3.dpuf

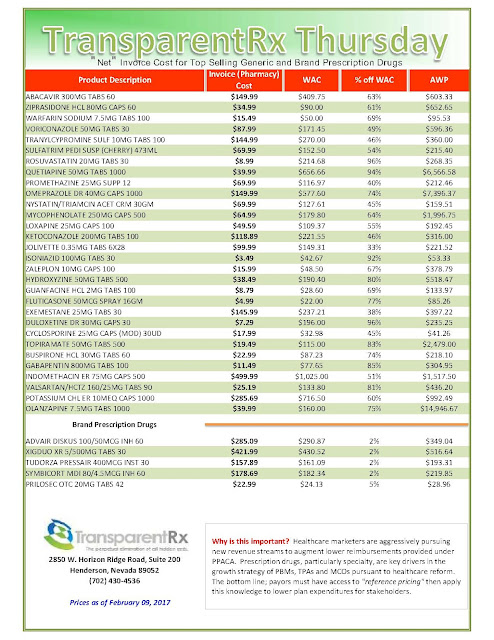
Reference Pricing: “Net” Invoice Cost for Top Selling Generic and Brand Prescription Drugs (Volume 129)

This document is updated weekly, but why is it important?  Healthcare marketers are aggressively pursuing new revenue streams to augment lower reimbursements provided under PPACA. Prescription drugs, particularly specialty, are key drivers in the growth strategies of PBMs, TPAs and MCOs pursuant to healthcare reform. 

The costs shared below are what the pharmacy actually pays; not AWP, MAC or WAC. The bottom line; payers must have access to “reference pricing.” Apply this knowledge to hold PBMs accountable and lower plan expenditures for stakeholders.


How to Determine if Your Company [or Client] is Overpaying


Step #1:  Obtain a price list for generic prescription drugs from your broker, TPA, ASO or PBM every month.


Step #2:  In addition, request an electronic copy of all your prescription transactions (claims) for the billing cycle which coincides with the date of your price list.

Step #3:  Compare approximately 10 to 20 prescription claims against the price list to confirm contract agreement.  It’s impractical to verify all claims, but 10 is a sample size large enough to extract some good assumptions.

Step #4:  Now take it one step further. Check what your organization has paid, for prescription drugs, against our pharmacy cost then determine if a problem exists. When there is a 5% or more price differential (paid versus actual cost) we consider this a problem.

Multiple price differential discoveries means that your organization or client is likely overpaying. REPEAT these steps once per month.

— Tip —

Always include a semi-annual market check in your PBM contract language. Market checks provide each payer the ability, during the contract, to determine if better pricing is available in the marketplace compared to what the client is currently receiving.

When better pricing is discovered the contract language should stipulate the client be indemnified. Do not allow the PBM to limit the market check language to a similar size client, benefit design and/or drug utilization. In this case, the market check language is effectually meaningless.
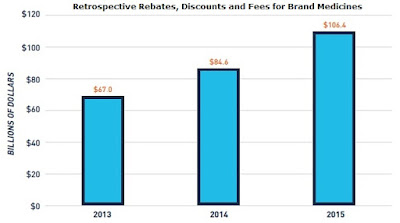
Note: Prices listed herein do not account for rebates, discounts or other purchase incentives which reduces the net cost.

Big companies form an alliance to find ways to reduce pharmacy costs

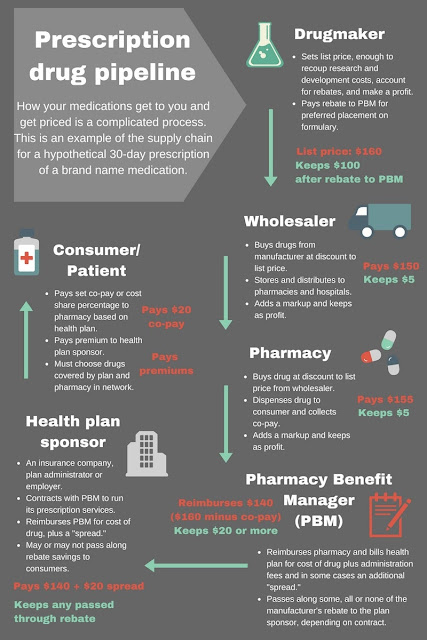
The path that prescription drugs take from the lab to your medicine chest is a long and complicated one. And the journey is made still more complex by the role of a very important, but little understood middleman known as the pharmacy benefits manager.

These companies fill a crucial role by negotiating with drug makers on behalf of health plans, unions, and some employers to get the best price, which is particularly critical as the cost of medicines is ever-rising. Yet PBMs also stir controversy over concerns they may not always pass along savings — called rebates — they negotiate for their clients, but instead pocket those funds to fatten their own bottom lines.

So a group of more than two dozen of the largest US corporations — including such household names as Macy’s, Coca-Cola, and American Express — recently formed an alliance to find ways to reduce health care costs. And one idea is to overhaul the way that PBMs are paid. Whether they have the clout to succeed is unclear, but Wall Street estimates the members of the alliance collectively spend $3 billion per year on pharmaceuticals.

The goal is to provide some transparency into a murky world — and it’s long overdue. To keep it simple, the Health Transformation Alliance, as it’s called, may seek to rewrite their contracts in order to eliminate any undisclosed drug company rebates that PBMs might hold back for themselves. Instead, the companies would pay PBMs for the actual cost of medicines, plus an agreed-upon fee.

Source: www.thethrivingpharmacist.com

Presumably, this would lower corporate health care bills that, in turn, could lower employee costs. There have been previous efforts over the years by corporate America to peel back the PBM curtain, but this approach would amount to a radical shift for the largest PBMs – notably, Express Scripts, CVS Caremark and United Healthcare’s Optum — which collectively manage about 70 percent of the pharmacy benefits in the United States.

Right now, though, big PBMs have the upper hand.

For instance, in their contracts with drug makers, a PBM may classify a rebate they’ve negotiated as a type of fee, allowing them to keep it rather than pass it on to their clients. This places the client at a big disadvantage because the contracts are proprietary, which makes it hard to know what the rebates really look like in the first place.

Read more >>

A Path Forward for Lowering Prescription Drug Prices

[Click to Enlarge]

It’s no secret that prescription drug prices are the fastest rising part of our healthcare system. That’s especially true in the cases of specialty and life-saving medications used to treat cancer, hepatitis C, and other rare diseases and ailments. But price increases are also prevalent among more common prescription medicines used by millions of Americans. The totality of these unsustainable, across-the-board price increases is impacting patients and those seeking access to such medications; it is also weighing down our health care system and the U.S. economy.

A recent Morning Consult opinion piece appears to miss this point, and moreover includes several citations that merit further clarification. For example, the author cited a controversial figure that pegs the average cost of developing a new prescription drug at $2.6 billion. But that number is far from accepted within the medical community. When the figure was initially floated in 2014, the director of policy and analysis for Doctors Without Borders put it plainly, “If you believe that, you probably also believe the earth is flat.”

Transparency about what is spent and how prices are set would improve the quality of the debate over drug pricing and actual value.

But the larger problem with arguments about the cost of developing drugs is a misunderstanding about the nature of “sunk costs.”  Simply put, sunk costs do not affect optimal price decisions.  Drug company cash flow today finances today’s R&D and marketing and profits.  Yesterday’s R&D was financed with yesterday’s cash flow. Today’s prices are set to maximize profits given today’s competitive conditions, regardless of how much or little any specific drug cost to develop.

Let’s be clear: the reason to avoid draconian price controls is to keep innovation flowing.  But we do not need to allow drug companies to make as much as they are making to keep today’s R&D flowing, since so much of their current cash flow – more than they spend on R&D according to Global Data is spent on marketing.  Clearly they could cut marketing, which rarely improves clinical quality for any patient, without harming today’s investment in the drugs of the future.

The core complaint about today’s competitive conditions is that we’ve allowed an unbalanced situation to develop.

We have lately over-incentivized innovation with very long extra periods of monopoly called “exclusivity” during which developers can keep their clinical trial data secret and force competitors to perform expensive and redundant trials.  This is the main problem with new incredibly expensive biologics and the biosimilars we are unnecessarily delaying from providing market competition. We have also allowed FDA backlogs for approving new generic drugs to lengthen due to lack of resources, and this has prevented lower cost generic drugs from getting to market.

Even established companies like Pfizer have piled on, increasing prices twice this year. The first increase came in January when prices for 133 of its medications rose by an average of 10.4 percent. It happened again just last month with another price hike averaging nearly 9 percent.  These hikes have nothing to do with past drug development costs.

This is not to debate the importance of developing life-saving drugs. The research and innovation of new treatments is critical to healing countless illnesses and diseases. Yet affordability and long-term health system sustainability must also be part of the equation.

Data from the Institute for Healthcare Informatics shows that over the last five years, prices for specialty drugs that require careful handling or administration have increased by a staggering $54 billion. These price increases accounted for 73 percent of increased U.S. spending on medications.

Read more >>

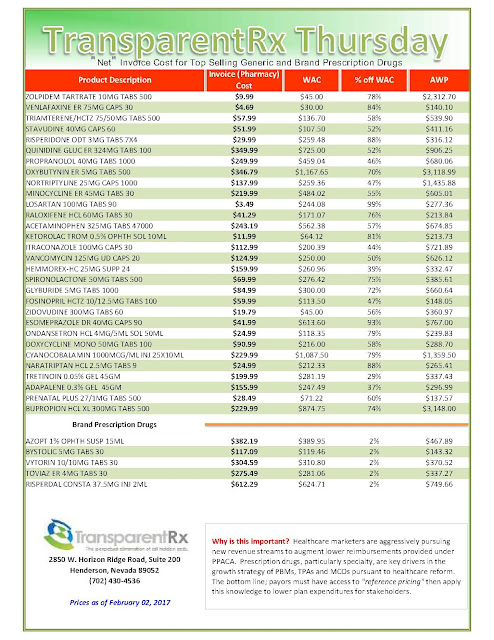
Reference Pricing: “Net” Invoice Cost for Top Selling Generic and Brand Prescription Drugs (Volume 128)

This document is updated weekly, but why is it important?  Healthcare marketers are aggressively pursuing new revenue streams to augment lower reimbursements provided under PPACA. Prescription drugs, particularly specialty, are key drivers in the growth strategies of PBMs, TPAs and MCOs pursuant to healthcare reform. 

The costs shared below are what the pharmacy actually pays; not AWP, MAC or WAC. The bottom line; payers must have access to “reference pricing.” Apply this knowledge to hold PBMs accountable and lower plan expenditures for stakeholders.


How to Determine if Your Company [or Client] is Overpaying


Step #1:  Obtain a price list for generic prescription drugs from your broker, TPA, ASO or PBM every month.


Step #2:  In addition, request an electronic copy of all your prescription transactions (claims) for the billing cycle which coincides with the date of your price list.

Step #3:  Compare approximately 10 to 20 prescription claims against the price list to confirm contract agreement.  It’s impractical to verify all claims, but 10 is a sample size large enough to extract some good assumptions.

Step #4:  Now take it one step further. Check what your organization has paid, for prescription drugs, against our pharmacy cost then determine if a problem exists. When there is a 5% or more price differential (paid versus actual cost) we consider this a problem.

Multiple price differential discoveries means that your organization or client is likely overpaying. REPEAT these steps once per month.

— Tip —

Always include a semi-annual market check in your PBM contract language. Market checks provide each payer the ability, during the contract, to determine if better pricing is available in the marketplace compared to what the client is currently receiving.

When better pricing is discovered the contract language should stipulate the client be indemnified. Do not allow the PBM to limit the market check language to a similar size client, benefit design and/or drug utilization. In this case, the market check language is effectually meaningless.

Note: Prices listed herein do not account for rebates, discounts or other purchase incentives which reduces the net cost.

Employers falling short on managing healthcare costs

The overwhelming majority of employers with 50-1,000 employees are missing out on opportunities to manage health costs more effectively, a new poll reveals.

A study of more than 400 senior HR and finance executives issued by insurance brokerage Hub International found that while 70% believe their strategies for “reining in costs” are successful, only 16% are using narrow networks, 18% are self-funding, and 31% are using pharmacy benefit carve-out strategies.

Potential health cost reductions from adopting those tactics range from 9% from self-funding, to 20% using a pharmacy carve-out, according to Linda Keller, national operating officer of employee benefits for the global insurance brokerage and risk mitigation service provider.

Not all-or-nothing

Whereas self-funding health benefits was once uneconomical for smaller employers, today “100% of companies can self-fund” and incur savings, Keller says. What’s holding many smaller employers back, she believes, is a misperception that self-funding is an all-or-nothing proposition in terms of risk assumption. Smaller companies may be more vulnerable to financial consequences of an erratic health claims pattern.

However, Keller points out, financing options are available to self-insured employers that level out funding requirements, plus stop-loss coverage can be tailored to accommodate the employer’s risk tolerance. However, there is no free lunch, she acknowledges. The more self-insuring looks and feels like a fully insured arrangement, the lower the savings that are available.

At a minimum, however, self-insuring eliminates the 2-3% premium tax that insurance carriers pay and build into their premium structure. Also, employers with a healthy workforce might do better by self-insuring than they would with a carrier due to the risk-pooling (including with higher-risk employers) inherent in insured arrangements, Keller says.

“If you think you have a lower risk profile, you can ease in to self-insuring to test your assumptions,” she says.

Source: lookfordiagnosis.com

Pharmacy carve-outs

The most dramatic potential savings, Keller asserts, are available from carving pharmacy benefits out of the medical plan. With the cost of drug benefits now typically totaling 20-25% of health costs and rising rapidly due to the proliferation of expensive targeted “designer” medications, it’s an area that larger employers have been focusing on for years.

The 20% average savings on drug benefit costs Keller says are enjoyed by Hub clients through carve-out arrangements is due not so much to lower negotiated drug prices or the elimination of rebates to insurance carriers from drug companies, but to more aggressive case management and utilization review.

Finally, smaller employers’ apparent reluctance to embrace “narrow networks,” as noted, may be costing them an average of 16% in foregone savings potential. Narrow networks limit approved providers to those deemed to offer high quality but the most cost-effective care.

Narrow networks

Employers reluctant to impose tight restrictions on provider access through such plans need not think of narrow networks as an either/or choice. Narrow network plans can (and generally do) sit side-by side-with traditional PPO plans, leaving the “consumers to think about how they want to spend their money,” Keller says.

She notes that as employers become more strategic in their use of voluntary benefits, they can expect higher rates of employees’ opting for narrow-network plans, and the savings they can provide. For example, if the voluntary benefits menu features life insurance, “an employee might decide, I’d rather use the savings from the narrow network plan to buy some life insurance,” Keller says.

“It all comes down to employee communication and education.”

Read more >>

Reference Pricing: “Gross” Invoice Cost for Top Selling Generic and Brand Prescription Drugs (Volume 127)

This document is updated weekly, but why is it important?  Healthcare marketers are aggressively pursuing new revenue streams to augment lower reimbursements provided under PPACA. Prescription drugs, particularly specialty, are key drivers in the growth strategies of PBMs, TPAs and MCOs pursuant to healthcare reform. 

The costs shared below are what the pharmacy actually pays; not AWP, MAC or WAC. The bottom line; payers must have access to “reference pricing.” Apply this knowledge to hold PBMs accountable and lower plan expenditures for stakeholders.


How to Determine if Your Company [or Client] is Overpaying


Step #1:  Obtain a price list for generic prescription drugs from your broker, TPA, ASO or PBM every month.


Step #2:  In addition, request an electronic copy of all your prescription transactions (claims) for the billing cycle which coincides with the date of your price list.

Step #3:  Compare approximately 10 to 20 prescription claims against the price list to confirm contract agreement.  It’s impractical to verify all claims, but 10 is a sample size large enough to extract some good assumptions.

Step #4:  Now take it one step further. Check what your organization has paid, for prescription drugs, against our pharmacy cost then determine if a problem exists. When there is a 5% or more price differential (paid versus actual cost) we consider this a problem.

Multiple price differential discoveries means that your organization or client is likely overpaying. REPEAT these steps once per month.

— Tip —

Always include a semi-annual market check in your PBM contract language. Market checks provide each payer the ability, during the contract, to determine if better pricing is available in the marketplace compared to what the client is currently receiving.

When better pricing is discovered the contract language should stipulate the client be indemnified. Do not allow the PBM to limit the market check language to a similar size client, benefit design and/or drug utilization. In this case, the market check language is effectually meaningless.

Note: Prices listed herein do not account for rebates, discounts or other purchase incentives which reduces the net cost.