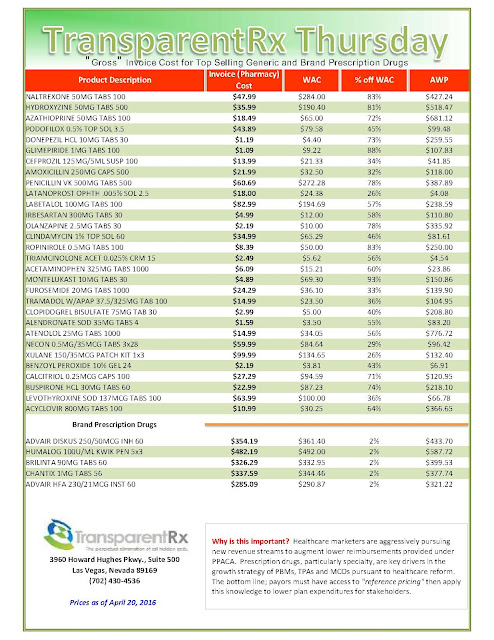
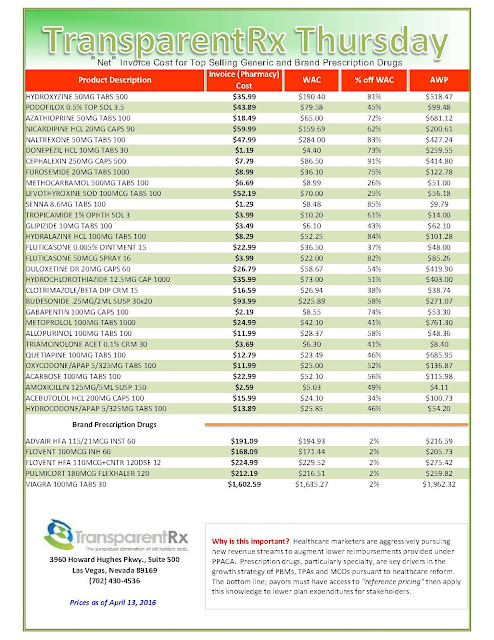
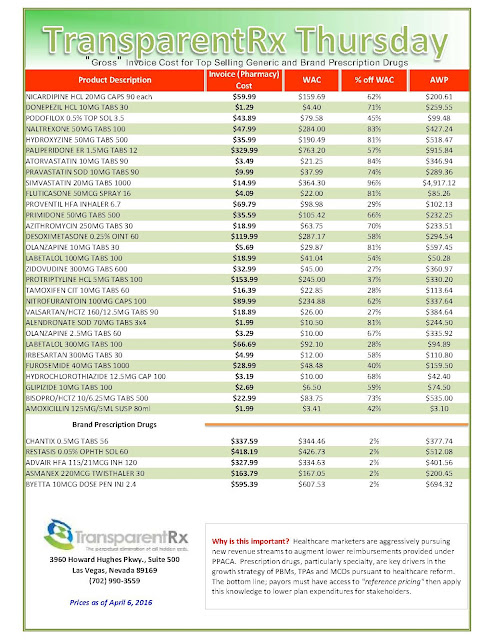
“Gross” Invoice Cost for Top Selling Generic and Brand Prescription Drugs – Volume 144

This document is updated weekly, but why is it important?  Healthcare marketers are aggressively pursuing new revenue streams to augment lower reimbursements provided under PPACA. Prescription drugs, particularly specialty, are key drivers in the growth strategies of PBMs, TPAs and MCOs pursuant to health care reform. 

The costs shared below are what the pharmacy actually pays; not AWP, MAC or WAC. The bottom line; payers must have access to “reference pricing.” Apply this knowledge to hold PBMs accountable and lower plan expenditures for stakeholders.

[Click to Enlarge]
How to Determine if Your Company [or Client] is Overpaying


Step #1:  Obtain a price list for generic prescription drugs from your broker, TPA, ASO or PBM every month.


Step #2:  In addition, request an electronic copy of all your prescription transactions (claims) for the billing cycle which coincides with the date of your price list.

Step #3:  Compare approximately 10 to 20 prescription claims against the price list to confirm contract agreement.  It’s impractical to verify all claims, but 10 is a sample size large enough to extract some good assumptions.

Step #4:  Now take it one step further. Check what your organization has paid, for prescription drugs, against our pharmacy cost then determine if a problem exists. When there is a 5% or more price differential (paid versus actual cost) we consider this a problem.

Multiple price differential discoveries means that your organization or client is likely overpaying. REPEAT these steps once per month.

— Tip —

Always include a semi-annual market check in your PBM contract language. Market checks provide each payer the ability, during the contract, to determine if better pricing is available in the marketplace compared to what the client is currently receiving.

When better pricing is discovered the contract language should stipulate the client be indemnified. Do not allow the PBM to limit the market check language to a similar size client, benefit design and/or drug utilization. In this case, the market check language is effectually meaningless.

Minnesota Department of Health finds drugs given in medical settings are big drivers of costs

Drugs given in medical settings are having a substantial impact on rising drug costs according to a new analysis conducted by the Minnesota Department of Health (MDH) in partnership with the PRIME Institute at the University of Minnesota.

Courtesy of MDH

The study analyzed claims data from 2009 to 2013 and found that the spending growth for drugs given in medical settings was nearly three times more than the spending growth for drugs from pharmacies (35.5 percent vs. 13.5 percent).

This finding sheds new light on the sources of growth in health care costs. This is the first time the state has compared the spending on drugs given in medical settings to those provided through pharmacies. Drugs given in medical settings are common for treating conditions such as cancer, multiple sclerosis, rheumatoid arthritis and autoimmune disease.

“Minnesota is one of the first states in the nation to show how drugs delivered in medical settings are increasingly important – and not well-understood – drivers of health care costs,” said Minnesota Commissioner of Health Dr. Ed Ehlinger. “We are hopeful that this first analysis from a planned series of publications will help insurers and policy makers find solutions for managing unsustainable trends.”

Minnesotans have an average of 15 prescription claims a year averaging about $90 each, according to the MDH analysis of claims data from 2009 to 2013. A claim could represent a single occasion when a patient received a drug in the doctor’s office or hospital, or a monthly refill of an ongoing prescription from a retail pharmacy.

Retail or other types of pharmacies filled about 80 percent of drug claims. These were paid for by a patient’s pharmacy insurance benefit. The remaining approximately 20 percent were given in medical settings, such as hospitals and clinics. They gave these drugs generally as a single dose, which were paid by a patient’s medical insurance benefit.

Total drug spending for Minnesota residents with health insurance, both at pharmacies and in medical settings, was $7.4 billion in 2013. Between 2009 and 2013, it grew 20.6 percent, or at twice the rate of inflation.

“Employers are very concerned about the pressure that both the unjustifiable cost and rate of increase in price and use of ‘specialty drugs’ have on their ability to provide affordable benefits to their employees and family members,” said Carolyn Pare, president and CEO of Minnesota Health Action Group. “We need to know that patients are getting the right drug, at the right time, in the right place.” Pare noted the MDH research helps her organization by offering benchmarks, and describing the patterns and costs of drug use.

Drugs given in medical settings accounted for more than half of this growth, even though these medical claim drugs only accounted for about 20 percent of all drug claims in 2013.

Tyrone’s comment: Is this the best argument yet for shifting specialty drugs from medical to the pharmacy benefit? 

Read more: http://hometownsource.com/2016/11/13/mdh-finds-drugs-given-in-medical-settings-are-big-drivers-of-costs/

“Gross” Invoice Cost for Top Selling Generic and Brand Prescription Drugs – Volume 143

This document is updated weekly, but why is it important?  Healthcare marketers are aggressively pursuing new revenue streams to augment lower reimbursements provided under PPACA. Prescription drugs, particularly specialty, are key drivers in the growth strategies of PBMs, TPAs and MCOs pursuant to health care reform. 

The costs shared below are what the pharmacy actually pays; not AWP, MAC or WAC. The bottom line; payers must have access to “reference pricing.” Apply this knowledge to hold PBMs accountable and lower plan expenditures for stakeholders.

How to Determine if Your Company [or Client] is Overpaying


Step #1:  Obtain a price list for generic prescription drugs from your broker, TPA, ASO or PBM every month.


Step #2:  In addition, request an electronic copy of all your prescription transactions (claims) for the billing cycle which coincides with the date of your price list.

Step #3:  Compare approximately 10 to 20 prescription claims against the price list to confirm contract agreement.  It’s impractical to verify all claims, but 10 is a sample size large enough to extract some good assumptions.

Step #4:  Now take it one step further. Check what your organization has paid, for prescription drugs, against our pharmacy cost then determine if a problem exists. When there is a 5% or more price differential (paid versus actual cost) we consider this a problem.

Multiple price differential discoveries means that your organization or client is likely overpaying. REPEAT these steps once per month.

— Tip —

Always include a semi-annual market check in your PBM contract language. Market checks provide each payer the ability, during the contract, to determine if better pricing is available in the marketplace compared to what the client is currently receiving.

When better pricing is discovered the contract language should stipulate the client be indemnified. Do not allow the PBM to limit the market check language to a similar size client, benefit design and/or drug utilization. In this case, the market check language is effectually meaningless.

Claims Analysis: Negotiated Pricing Between Preferred and Non-Preferred Retail Pharmacies

CMS Analysis: preferred vs. non-preferred pharmacy networks

CVS Health announced Tuesday that it expects to lose 40 million retail prescriptions next year because of new retail pharmacy networks that don’t include CVS, such as those created by Walgreens’ partnerships.

This year, Deerfield-based Walgreens formed partnerships with a number of pharmacy benefit managers, which are companies that manage prescription drug benefits for insurers and employers. Those partnerships make Walgreens a preferred pharmacy for people with certain health insurance plans, meaning medications for those customers are significantly cheaper at Walgreens and other in-network pharmacies than at drugstores that aren’t part of those networks.

Tyrone’s comment: A CMS analysis has proved this theory (cheaper medications in preferred networks) to be inconsistent at best. While medications may cost patients less at the point-of-sale, it turns out they could actually be more expensive to payers in a preferred network.

In September, Express Scripts, the pharmacy benefit manager for the U.S. military’s health insurance program, announced that on Dec. 1 it would add Walgreens to the military health insurance program’s network and drop CVS. That means those with military health insurance, known as Tricare, will have to get their prescriptions at Walgreens or other in-network pharmacies starting Dec. 1 or pay significantly higher rates for them elsewhere.

In August, Walgreens announced a partnership with pharmacy benefit manager Prime Therapeutics, which is owned by 14 Blue Cross and Blue Shield plans and has 22 million members. Walgreens also partnered in March with benefit manager OptumRx, which is part of UnitedHealth Group and has 66 million members.

Walgreens has been particularly aggressive in pursuing such deals, said Vishnu Lekraj, a senior equity analyst at Morningstar in Chicago. The benefit managers restrict which drugstores can be part of their networks to get better discounts on drugs from pharmacies such as Walgreens, he said.

CVS has its own pharmacy benefit manager business, and CVS President and CEO Larry Merlo said in a news release Tuesday the he expects a “healthy increase” in operating profit growth next year in that area. He said, however, that he expects a decrease in retail operating profit growth.

Tyrone’s comment:  I hope self-funded employers are paying attention to this comment because it is significant. An increase in operating profit occurs one of two ways; increase in revenues and/or cost-cutting measures. In other words, Caremark will look to grow its account base but also increase incremental revenue from existing clients.

Read more:  http://www.chicagotribune.com/business/ct-walgreens-cvs-prescriptions-1109-biz-20161108-story.html

PAs (prior authorization) work, if done right

For a physician, it’s hard not to hate prior authorization programs. They interpose administrative hassles,  they are often not designed thoughtfully, they can delay care, and they interfere with autonomy. For a patient, it’s hard to like prior authorization programs. An outside party, often untrusted, second-guesses your physician – and your health feels like it’s held hostage.

[Click to Enlarge]

For a health plan administrator looking to improve the quality of care, reduce thoughtless use of expensive drugs, and lower costs it’s hard to see how not to impose prior authorization.

Lee Newcomber of United Health Care and colleagues reported in The Journal of Clinical Oncology Practice on a thoughtfully designed prior authorization program for chemotherapy implemented only in Florida – and compared costs in Florida compared to the rest of the Southeast, and then compared to the rest of the country.  Costs went down by 9% in Florida, and went up by 10-11% in the comparison geographies.   Only 42 cases (1%) were denied. Savings totaled $5.3 million for the pilot program.

The program used National Comprehensive Cancer Network (NCCN) guidelines, which were digitized by a third party.  Oncologists had to submit the minimal amount of information to get to a NCCN decision node, and were offered a series of choices. They only needed to get prior authorization if they were prescribing medications not listed as appropriate by NCCN.

Tyrone’s comment: PAs, for biologics, can easily run into the $400 to $500 range so be prudent in managing this service along with the associated costs. Ask your PBM who handles PAs and what, if anything, their specialty pharmacy does to help patients finance their cost share (i.e. co-pay cards, coupons, patient assitance programs and/or nonprofits). Lastly, a quarterly cost-benefit analysis could prove to be very worthwhile. 

Characteristics of this program which made it far less onerous than many prior auth programs:

1)   Requested the minimal amount of information necessary
2)   Used guidelines that were promulgated by a trusted source, and were open source (nonproprietary)
3)   Allowed providers to do “self service” if they stayed on the clinical pathway
4)   Committed to 24 hour turnaround times for “non-pathway” treatment
5)   Allowed “grandfathering” of patients already on “non-pathway” treatment

The high rate of administrative expiration was described as being due to administrative errors, duplicates, out-of-state physicians mistakenly using the system, and change in patient status.

This program, which the authors call “decision support” rather than “prior authorization,” replaced a previous program that asked physicians to follow the NCCN guidelines and denied claims if they went outside the guidelines without prior authorization. The previous program led to many calls for “permission” that were unnecessary, and led to 7% denial rates.

Doctors and patients will continue to despise prior authorization programs. But it appears that this program was able to save significant dollars, keep more patients on an NCCN pathway, and minimize hassles. It’s a good model that should be replicated elsewhere.

By Jeff Levin-Scherz

“Gross” Invoice Cost for Top Selling Generic and Brand Prescription Drugs – Volume 142

This document is updated weekly, but why is it important?  Healthcare marketers are aggressively pursuing new revenue streams to augment lower reimbursements provided under PPACA. Prescription drugs, particularly specialty, are key drivers in the growth strategies of PBMs, TPAs and MCOs pursuant to health care reform. 

The costs shared below are what the pharmacy actually pays; not AWP, MAC or WAC. The bottom line; payers must have access to “reference pricing.” Apply this knowledge to hold PBMs accountable and lower plan expenditures for stakeholders.

How to Determine if Your Company [or Client] is Overpaying


Step #1:  Obtain a price list for generic prescription drugs from your broker, TPA, ASO or PBM every month.


Step #2:  In addition, request an electronic copy of all your prescription transactions (claims) for the billing cycle which coincides with the date of your price list.

Step #3:  Compare approximately 10 to 20 prescription claims against the price list to confirm contract agreement.  It’s impractical to verify all claims, but 10 is a sample size large enough to extract some good assumptions.

Step #4:  Now take it one step further. Check what your organization has paid, for prescription drugs, against our pharmacy cost then determine if a problem exists. When there is a 5% or more price differential (paid versus actual cost) we consider this a problem.

Multiple price differential discoveries means that your organization or client is likely overpaying. REPEAT these steps once per month.

— Tip —

Always include a semi-annual market check in your PBM contract language. Market checks provide each payer the ability, during the contract, to determine if better pricing is available in the marketplace compared to what the client is currently receiving.

When better pricing is discovered the contract language should stipulate the client be indemnified. Do not allow the PBM to limit the market check language to a similar size client, benefit design and/or drug utilization. In this case, the market check language is effectually meaningless.

Note: Prices listed herein are gross thus do not account for rebates, discounts or other purchase incentives which ultimately reduces the net cost.

“Gross” Invoice Cost for Top Selling Generic and Brand Prescription Drugs – Volume 141

This document is updated weekly, but why is it important?  Healthcare marketers are aggressively pursuing new revenue streams to augment lower reimbursements provided under PPACA. Prescription drugs, particularly specialty, are key drivers in the growth strategies of PBMs, TPAs and MCOs pursuant to health care reform. 

The costs shared below are what the pharmacy actually pays; not AWP, MAC or WAC. The bottom line; payers must have access to “reference pricing.” Apply this knowledge to hold PBMs accountable and lower plan expenditures for stakeholders.

How to Determine if Your Company [or Client] is Overpaying


Step #1:  Obtain a price list for generic prescription drugs from your broker, TPA, ASO or PBM every month.

Step #2:  In addition, request an electronic copy of all your prescription transactions (claims) for the billing cycle which coincides with the date of your price list.

Step #3:  Compare approximately 10 to 20 prescription claims against the price list to confirm contract agreement.  It’s impractical to verify all claims, but 10 is a sample size large enough to extract some good assumptions.

Step #4:  Now take it one step further. Check what your organization has paid, for prescription drugs, against our pharmacy cost then determine if a problem exists. When there is a 5% or more price differential (paid versus actual cost) we consider this a problem.

Multiple price differential discoveries means that your organization or client is likely overpaying. REPEAT these steps once per month.

— Tip —

Always include a semi-annual market check in your PBM contract language. Market checks provide each payer the ability, during the contract, to determine if better pricing is available in the marketplace compared to what the client is currently receiving.

When better pricing is discovered the contract language should stipulate the client be indemnified. Do not allow the PBM to limit the market check language to a similar size client, benefit design and/or drug utilization. In this case, the market check language is effectually meaningless.

Note: Prices listed herein are gross thus do not account for rebates, discounts or other purchase incentives which ultimately reduces the net cost.

Survey supports transparency of drug pricing by pharmacy benefit managers

A recent report found that customers are very satisfied overall with pharmacy benefit managers and their services. The report also indicated a slight increase in satisfaction from the previous year.

Pharmacy benefit managers (PBMs) have come under fire recently due to outrage over high drug prices, with some critics blaming PBMs for the cost growth. However, many PBMs attest that they have been saving patients and the healthcare industry money through their negotiated drug costs and formulary exclusion lists.

PBMs are also faced with rising drug costs, and they respond by removing drugs from their formulary lists when a less costly alternative is available. Since they can use these lists to negotiate prices, these policies have largely had a positive impact on costs, and have not been seen to affect patient access to medications, according to the Pharmacy Benefit Management Institute’s 2016 PBM Customer Satisfaction Report.

Figure 1
Despite criticism, overall satisfaction with PBMs continues to increase, according to the report, which found that customer satisfaction increased from 7.7 in 2015 to 7.8 in 2016. Included in the report are responses from 507 plan sponsors representing employers providing drug coverage for more than 54.7 million individuals.

Approximately 83% of plan sponsors indicated that their PBM is also aligned with their goals, which is important so employees can receive the services and care that is needed.

Transparency has become increasingly important for Americans facing high healthcare costs, including drug costs. Of the plan sponsors that responded, 91% felt that their PBM’s pricing was somewhat or completely transparent.

Tyrone’s comment: There is no standard industry definition for transparency so how is it defined and, more importantantly, measured here? I offer up a definition above (
figure 1). Finally, I don’t for a second think plan sponsors would believe their PBM to be completely transparent if they knew the truth behind the numbers. I speak with dozens of Benefits Directors, Benefits Consultants and CFOs weekly only to discover how little they know about PBM fundamentals such as plan design and cost-containment. So its not surprising to see such positive survey results when the respondents’ heads are in the sand. 

Plan sponsors also rated 5 of 9 PBM functions an 8 or higher on the satisfaction scale. Retail network options received the highest rating of 8.5 in the survey.

The respondents rated formulary management the highest rated noncore service, and consumer education tools as the lowest. Interestingly, the highest- and lowest-rated services were only separated by 0.5 points.

Delivery of services and utilization management scored a 7.9 for the specialty aspects of the PBM, the researchers said. Satisfaction across all service dimensions did not significantly change from 2015.

Overall, plan sponsors were likely to renew their contracts with their PBM, and ranked that likelihood an 8.1. These findings suggest that PBMs are achieving their goals of providing beneficial services, driving positive patient outcomes, and reducing drug costs, according to the report.

“Our research shows that PBMs who can deliver high quality services, have aligned goals with clients, and help maintain employee and member satisfaction in turn have highly satisfied customers,” Jane Lutz, executive director of Pharmacy Benefit Manager Institute, said in a press release. “In the competitive PBM marketplace, customer satisfaction is a key differentiator. Highly satisfied customers are more likely to renew services with their current PBM and even refer potential customers to their existing PBM.”

“Gross” Invoice Cost for Top Selling Generic and Brand Prescription Drugs – Volume 140

This document is updated weekly, but why is it important?  Healthcare marketers are aggressively pursuing new revenue streams to augment lower reimbursements provided under PPACA. Prescription drugs, particularly specialty, are key drivers in the growth strategies of PBMs, TPAs and MCOs pursuant to health care reform. 

The costs shared below are what the pharmacy actually pays; not AWP, MAC or WAC. The bottom line; payers must have access to “reference pricing.” Apply this knowledge to hold PBMs accountable and lower plan expenditures for stakeholders.

How to Determine if Your Company [or Client] is Overpaying


Step #1:  Obtain a price list for generic prescription drugs from your broker, TPA, ASO or PBM every month.

Step #2:  In addition, request an electronic copy of all your prescription transactions (claims) for the billing cycle which coincides with the date of your price list.

Step #3:  Compare approximately 10 to 20 prescription claims against the price list to confirm contract agreement.  It’s impractical to verify all claims, but 10 is a sample size large enough to extract some good assumptions.

Step #4:  Now take it one step further. Check what your organization has paid, for prescription drugs, against our pharmacy cost then determine if a problem exists. When there is a 5% or more price differential (paid versus actual cost) we consider this a problem.

Multiple price differential discoveries means that your organization or client is likely overpaying. REPEAT these steps once per month.

— Tip —

Always include a semi-annual market check in your PBM contract language. Market checks provide each payer the ability, during the contract, to determine if better pricing is available in the marketplace compared to what the client is currently receiving.

When better pricing is discovered the contract language should stipulate the client be indemnified. Do not allow the PBM to limit the market check language to a similar size client, benefit design and/or drug utilization. In this case, the market check language is effectually meaningless.

Note: Prices listed herein are gross thus do not account for rebates, discounts or other purchase incentives which ultimately reduces the net cost.