Emerging Trends in the Specialty Drug Market

Specialty drugs continue to make up a large portion of drug development and many specialty medications could soon see generic competition as the patents on 30 specialty products expire before 2020. These are a few of the emerging trends in the specialty drug market that were discussed during a session at the AMCP Specialty Pharmacy Conference.
 
The session, led by Aimee Tharaldson, PharmD, senior clinical consultant, emerging therapeutics, Express Scripts, highlighted key specialty pharmaceuti- cal trends, reviewed recently approved specialty medications, and looked ahead at new medications on the horizon. Drugs are considered specialty medications if they require frequent dosing adjustments or intensive clinical monitoring, if they require patient training, if they have a limited distribution, or if they require specialized handling. The prevalence of these type of drugs in the marketplace only continues to grow. According to data presented by Dr. Tharaldson, there was a greater number of FDA approvals in 2014 for specialty drugs than traditional medications, a trend that has consistently occurred since 2010.
 
While specialty medications are used to treat <1% of patients, they represent 32% of drug spend. “Due to the high cost of specialty medications, use of clinically appropriate management tools are necessary to ensure that patients have access to medications that improve health outcomes,” she said.
 
Within the specialty market, experts are seeing increased competition, more development of orphan drugs, and a number of drugs receiving designation as a breakthrough therapy. One indication of the increasing competition within the industry is the growing number of medications within therapy classes. For instance, in 2005, there were just 4 specialty medications for hepatitis C but that number has now grown to 13 in 2015. Just 10 years ago, no specialty drugs were approved to treat melanoma but now 6 drugs have reached the market.
 
Trends in the Specialty Market
 
A large number of patents on specialty and biologic products are also set to expire in the years ahead, creating new opportunity for generics. Dr. Tharaldson shared that 30 specialty products will face patent expirations before 2020, creating a $14.1 billion specialty generic opportunity. By the end of 2020, patents on 54 biologic products are set to expire creating an even larger $39.1 billion opportunity for biosimilars. The first biosimilar to hit the market received FDA approval earlier this spring and an additional 4 biosimilars are anticipated to earn approval this year.
 
“Initially, filgrastim-sndz and other early biosimilars are expected to act more like competing brands in the market,” Dr. Tharaldson said. It is expected, according to Dr. Tharaldson, that as interchangeability increases the poten- tial for cost savings with biosimilars will also increase. Another trend in the specialty market is the extensive number of orphan drugs in development; 41% of the drugs in the specialty pipeline are considered orphan drugs. Cancer drugs, the next highest category, make up 21% of the pipeline.
 
Since 2013, 15 drugs have been approved as breakthrough therapies. This designation is given to a drug or drug combination that treats a serious or life-threatening disease and has early evidence that it might provide a substantial improvement over existing therapies. In the current specialty market, the leading specialty drug therapy classes based on per member per year (PMPY) costs for 2014 are inflammatory conditions ($80/PMPY), multiple sclerosis ($52/ PMPY), and cancer ($42/PMPY). In 2014, specialty drug approvals were approved for indications ranging from ovarian cancer, to Gaucher disease and melanoma.
 
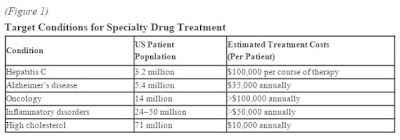
Proprotein convertase subtilisin/kexin type 9 (PCSK9) inhibitors, which are very effective in lowering low-density lipoprotein cholesterol, will enter the market this summer and could significantly impact pharmacy drug spend due to their potential to treat a large population of people. “PCSK9 inhibitors may cost $4000 to $12,000 per year,” said Dr. Tharaldson.
 
To continue reading click here.

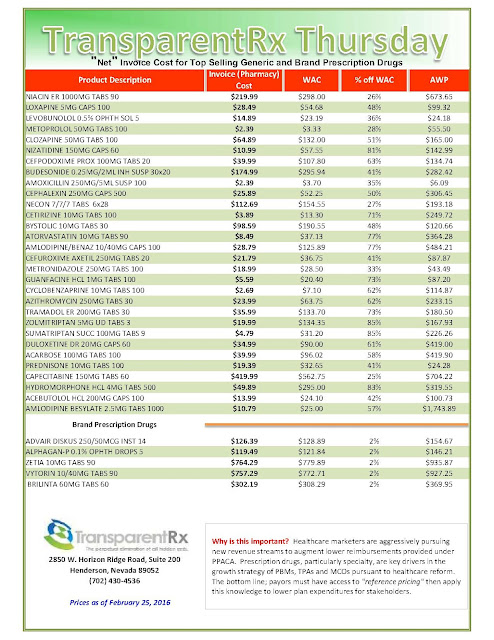
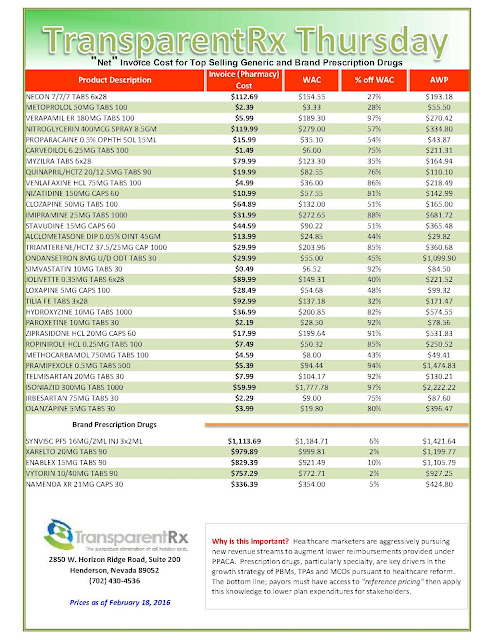
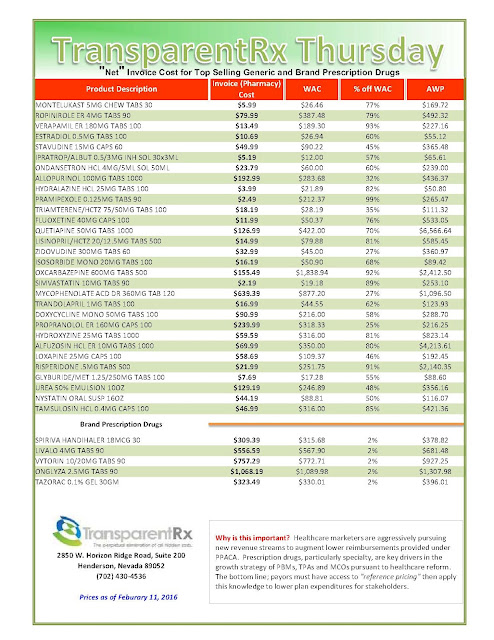
Reference Pricing: “Net” Ingredient Cost for Top Selling Generic and Brand Prescription Drugs

Why is this document important?  Healthcare marketers are aggressively pursuing new revenue streams to augment lower reimbursements provided under PPACA. Prescription drugs, particularly specialty, are key drivers in the growth strategies of PBMs, TPAs and MCOs pursuant to healthcare reform. 

The costs shared below are what our pharmacy actually pays; not AWP, MAC or WAC. The bottom line; payers must have access to “reference pricing.” Apply this knowledge to hold PBMs accountable and lower plan expenditures for stakeholders.

How to Determine if Your Company [or Client] is Overpaying

Step #1:  Obtain a price list for generic prescription drugs from your broker, TPA, ASO or PBM every month.


Step #2:  In addition, request an electronic copy of all your prescription transactions (claims) for the billing cycle which coincides with the date of your price list.

Step #3:  Compare approximately 10 to 20 prescription claims against the price list to confirm contract agreement.  It’s impractical to verify all claims, but 10 is a sample size large enough to extract some good assumptions.

Step #4:  Now take it one step further. Check what your organization has paid, for prescription drugs, against our pharmacy cost then determine if a problem exists. When there is a 5% or more price differential (paid versus actual cost) we consider this a problem.

 
Multiple price differential discoveries means that your organization or client is likely overpaying. REPEAT these steps once per month.
 
— Tip —
 
Always include a semi-annual market check in your PBM contract language. Market checks provide each payer the ability, during the contract, to determine if better pricing is available in the marketplace compared to what the client is currently receiving.

When better pricing is discovered the contract language should stipulate the client be indemnified. Do not allow the PBM to limit the market check language to a similar size client, benefit design and/or drug utilization.  In this case, the market check language is effectually meaningless.

Will Specialty Oncology Products Follow the Sovaldi Way?

Bruce Feinberg, DO, vice president and chief medical officer of Cardinal Health Specialty Solutions, moderated the panel that consisted of Scott Gottlieb, MD, resident fellow at the American Enterprise Institute; Brian Kiss, MD, vice president of healthcare transformation at Blue Cross Blue Shield of Florida; Michael Kolodziej, MD, national medical director for oncology strategy at Aetna; and Ted Okon, MBA, executive director of Community Oncology Alliance (COA).

While precision medicine has tremendous potential and expands patient options, the growth in the field of oral therapeutics will significantly affect payers, said Feinberg, because of the arbitrary separation that exists between pharmacy benefit and medical benefit. Feinberg explained that oral therapeutics will have a huge impact on physician clinics where chemotherapeutic infusions were traditionally administered, because not all clinics have the ability to dispense these medications through an onsite pharmacy, and in many cases state laws prohibit it. He also questioned whether oral treatments will be effective in maintaining patient-centeredness.

Patients often mistake oral therapy for a cheaper alternative to chemotherapy, said Okon. He agreed with Feinberg that with oral medications accounting for 25% to 35% of the oncology pipeline, we have a new situation to which everyone must adapt. Okon went on to explain the real-world problems with oral therapeutics, especially concerning treatment adherence.  


While the provider retains control with infusion treatments, with oral drugs, the onus lies with the patient. “We’ve done a lot of research at COA on this, and basically, it’s actually tied to cost,” he said. According to Okon, studies have shown that irrespective of cost, 10% of patients don’t fill even the first prescription, which complicates clinical and payer decisions if the treatment fails. 

Feinberg turned to the payers in the room, asking each to explain the strategy for medication therapy management, adherence, compliance, and persistence, and how these expensive medications impact the overall payer budget.

The Payer Strategy

Kiss said that payers have found a way out: negotiating price deals with vendors. But these channels may not be accessible to a clinical oncologist, he said. “So you have a drug that’s $1000, which may be the patient’s out-of-pocket cost. They take the prescription to their Walgreens. And you know Walgreens can get the drug in 48 hours and still do it, but [now] instead of being $1000, it may be $1400.” These variables have resulted in an increasing shift of cost burden to the patient, according to Kiss. 

Another complication is that patients have the option of receiving these oral oncology drugs by mail order; if they cannot tolerate the side effects of the drug, they might stop taking them in a few days, “Which can result in huge wastage because now they have the rest of the month’s supply in their medicine cabinet.” Both Feinberg and Kiss noted that this problem is not confined to oncology; already, we are seeing a spillover into rheumatology and other therapeutic areas where novel oral therapeutics are being developed. 

See more at: http://www.ajmc.com/journals/evidence-based-oncology/2015/The-American-Society-of-Clinical-Oncology-Annual-Meeting-2015/Will-Specialty-Oncology-Products-Follow-the-Sovaldi-Way#sthash.jGnchLVI.dpuf

Reference Pricing: “Net” Ingredient Cost for Top Selling Generic and Brand Prescription Drugs

Why is this document important?  Healthcare marketers are aggressively pursuing new revenue streams to augment lower reimbursements provided under PPACA. Prescription drugs, particularly specialty, are key drivers in the growth strategies of PBMs, TPAs and MCOs pursuant to healthcare reform. 

The costs shared below are what our pharmacy actually pays; not AWP, MAC or WAC. The bottom line; payers must have access to “reference pricing.” Apply this knowledge to hold PBMs accountable and lower plan expenditures for stakeholders.

How to Determine if Your Company [or Client] is Overpaying

Step #1:  Obtain a price list for generic prescription drugs from your broker, TPA, ASO or PBM every month.


Step #2:  In addition, request an electronic copy of all your prescription transactions (claims) for the billing cycle which coincides with the date of your price list.

Step #3:  Compare approximately 10 to 20 prescription claims against the price list to confirm contract agreement.  It’s impractical to verify all claims, but 10 is a sample size large enough to extract some good assumptions.

Step #4:  Now take it one step further. Check what your organization has paid, for prescription drugs, against our pharmacy cost then determine if a problem exists. When there is a 5% or more price differential (paid versus actual cost) we consider this a problem.

 
Multiple price differential discoveries means that your organization or client is likely overpaying. REPEAT these steps once per month.
 
— Tip —
 
Always include a semi-annual market check in your PBM contract language. Market checks provide each payer the ability, during the contract, to determine if better pricing is available in the marketplace compared to what the client is currently receiving. 

When better pricing is discovered the contract language should stipulate the client be indemnified. Do not allow the PBM to limit the market check language to a similar size client, benefit design and/or drug utilization.  In this case, the market check language is effectually meaningless.


Controlling Pharmacy Costs

Two themes have driven what I’ve covered in this column this year: how to treat employees with dignity through the benefits we offer, and how to create beautiful, elegant benefits solutions that work.

Under these guidelines, I believe I’ve found a company that accomplishes both: GoodRx—a web and app-based service providing consumers with the lowest prices available on prescription drugs. (Note: I have no financial relationship with this company or its leadership.)

When GoodRx first came on my radar in 2012, the company’s co-founder, Doug Hirsch, described their mission this way: “We want to mimic companies like Orbitz and create prescription-drug-price transparency so consumers are informed and can afford the medications they need.” 

I reconnected with Hirsch in early 2015 after having a personal GoodRx experience. I was picking up the one prescription drug I take and was surprised to find at the register that my health plan no longer covered the medication. My pharmacist told me I was responsible for the $100 charge. After pausing for a moment, I remembered I had the GoodRx app on my smartphone. To my delight, I discovered my pharmacy offered the lowest price available with the GoodRx discount. I saved $40 on the spot.

I contacted Hirsch to thank him for the savings, and discovered in the ensuing conversation that the company had grown its services to include a transparent pharmacy benefit management program for employers, as well as a GoodRx platform for physicians, and even a GoodRx search for pet pharmaceuticals.

After further research on GoodRx and the PBM world in general, I wanted to share key points with HR leaders.

PBMs first came into being during the mid-1980s. They largely acted as a third-party administrator for pharmacy claims and held a fiduciary responsibility to clients to find the best prices for prescription drugs. PBMs managed two contracts to produce its services: one with the pharmacy networks it created, and the other with the plan sponsors (a self-insured employer or a health plan).

The mail-order pharmacy business began in the early 1990s. In this scenario, PBMs were no longer negotiating with pharmacy networks; they were negotiating with themselves.  

Dispensing through their own mail-order pharmacy allows PBMs to ensure patient adherence to treatment and formulary compliance, using in-house pharmacists to contact physicians to switch patients to preferred brand drugs or get prescriptions renewed. Greater ability to shift share can bring larger rebates on brands.

When you talk with PBM experts, most will highlight the cost of PBM services as a combination of administrative fees, manufacturer revenue and spread. The primary caution they will share with employers, however, is the need to understand “spread.”

According to a paper written for the Department of Labor’s 2014 ERISA Advisory Council, here is an example of how spread works:

“The PBM may reimburse pharmacies for drugs at the [Average Wholesale Price] minus 18 percent plus a dispensing fee. These payment rates at which PBMs reimburse pharmacies are not generally known to plan sponsors. The PBM contracts for reimbursement from the sponsor at a somewhat smaller discount off AWP, say AWP minus 16 percent plus a $2 administration fee per script. The difference between the sponsor’s payment rate to the PBM and the PBM’s payment rate to the pharmacy is known as the ‘retail spread’ and is a significant source of PBM’s net revenue.”

To read more click here.

Reference Pricing: “Net” Ingredient Cost for Top Selling Generic and Brand Prescription Drugs

Why is this document important?  Healthcare marketers are aggressively pursuing new revenue streams to augment lower reimbursements provided under PPACA. Prescription drugs, particularly specialty, are key drivers in the growth strategies of PBMs, TPAs and MCOs pursuant to healthcare reform. 

The costs shared below are what our pharmacy actually pays; not AWP, MAC or WAC. The bottom line; payers must have access to “reference pricing.” Apply this knowledge to hold PBMs accountable and lower plan expenditures for stakeholders.

How to Determine if Your Company [or Client] is Overpaying

Step #1:  Obtain a price list for generic prescription drugs from your broker, TPA, ASO or PBM every month.


Step #2:  In addition, request an electronic copy of all your prescription transactions (claims) for the billing cycle which coincides with the date of your price list.

Step #3:  Compare approximately 10 to 20 prescription claims against the price list to confirm contract agreement.  It’s impractical to verify all claims, but 10 is a sample size large enough to extract some good assumptions.

Step #4:  Now take it one step further. Check what your organization has paid, for prescription drugs, against our pharmacy cost then determine if a problem exists. When there is a 5% or more price differential (paid versus actual cost) we consider this a problem.

 
Multiple price differential discoveries means that your organization or client is likely overpaying. REPEAT these steps once per month.
 
— Tip —
 
Always include a semi-annual market check in your PBM contract language. Market checks provide each payer the ability, during the contract, to determine if better pricing is available in the marketplace compared to what the client is currently receiving. 

When better pricing is discovered the contract language should stipulate the client be indemnified. Do not allow the PBM to limit the market check language to a similar size client, benefit design and/or drug utilization.  In this case, the market check language is effectually meaningless.

Time to Blow Up Your PBM Strategy — Here’s How

Some of the main causes of plan sponsor excessive remuneration for pharmacy benefits include specialty medications, pharmacy benefit manager contracts, plan design strategy and employee demographics and dynamics.

If you’re facing any of the main causes for cost increases listed above or are working to improve patient outcomes while managing rising pharmacy benefit costs, continue reading. It may be time to blow up your PBM strategy.

Marshal In-House Experts.  Mom always said, “When you absolutely need something done right, do it yourself.” Still today, this philosophy often proves true. When employers truly comprehend the ramifications of how PBMs make money, the employer is in a much better position to successfully manage the PBM relationship and to negotiate contracts that maximize the value in the prescription drug plan.  This is especially true for employers who lack internal expertise, from both sides of the table, in pharmacy and/or pharmacy benefits.

Vet PBM Consultants not just for “advice” but Implementation and Execution.  PBM consulting is not a one-off linear implementation, but a lifecycle of iterative and multi-layered phases.  Each phase has its own set of practices and disciplines that are essential for optimizing processes against set performance outcomes.  PBM consultants should help clients to assess, analyze and determine a viable roadmap initially and then build momentum throughout the contract term with consistent, incremental deliveries demonstrating measurable and meaningful business gain.

Reverse Auctions – Dump the Traditional RFP. Reverse auctions create a hyper-competitive environment, driving best value for payers. The process often yields savings of more than 15% and allows the payer to probe deeper into the PBM’s formulary structure and their inclusion of high-cost specialty drugs that often require special handling and administrative complexities.

 
Once a daunting task for companies, open bids are easier to execute with newly available, sophisticated RFP technology that reduces the time and money spent on determining and securing the best prices and contractual terms. Payers must create their own fiduciary contract and put it out for bid vis-à-vis reverse auctions.

Demand a Fiduciary Standard from Your PBM.  A fiduciary is someone who has undertaken to act for and on behalf of another in a particular matter in circumstances which give rise to a relationship of trust and confidence. A fiduciary duty is the highest standard of care at either equity or law. A fiduciary is expected to be extremely loyal to the person to whom he owes the duty (the “principal”): he must not put his personal interests before the duty, and must not profit from his position as a fiduciary unless the principal consents.

How is it that a plan sponsor, regardless of size, can sign a deal which doesn’t hold its PBM accountable to a client-comes-first standard of care? High Flying Organizations (HFOs) are hustled out of their hard-earned money every day by some TPAs and pharmacy benefit managers. Add an additional safety net by requiring your PBM to sign as a fiduciary. Be prepared, your legacy PBM may not offer a fiduciary contract; here’s why.

 
Think of Prescription Drugs not just as a Cost but a Cost Offset Opportunity.  Type 2 diabetes is a progressive disease which usually occurs slowly over time, for example.  Most people with the disease are overweight or obese upon diagnosis. Increased fat makes it harder for the body to use insulin the correct way. In my opinion, type 2 diabetes is the disease state which offers payers the largest cost offset opportunity.
 
The goal of treatment, at first, is to lower high blood glucose levels.  Long-term goals are to prevent problems from diabetes.  The most important way to treat and manage type 2 diabetes is with activity and healthy eating.  While some patients heed the advice of their physician; exercise more often and adopting a healthy diet, most do not.  Consequently, the disease will progress eventually causing severe nerve damage, kidney failure or blindness.
 
One solution, every member diagnosed with type 2 diabetes should receive Tier 1 medications at no cost and automatic enrollment in a MTM or medication therapy management program.  That’s right, free!  With that in mind, here is my template of a bleeding-edge four tier plan design:
  • Tier 1 (Rx1) comprises only lower-cost generic drugs.  The medications are simply less expensive yet efficacious. 
  • Tier 2 is reserved for most injectables, gene therapies, and biotechnology treatments.  Isn’t it time to reposition brand drugs and include only generic and specialty drugs in the first two tiers?  In order to protect their rebate dollars, PBMs will oppose this idea.
  • Tier 3 consists primarily of 2nd and 3rd generation brand drugs.  These are reserved for brand drugs which do not have a generic substitute or therapeutic equivalent in Rx1.    
  • Tier 4 is made up of 1st generation brand molecules (non-preferred) which have generic or therapeutic equivalents in upper tiers and some injectables.
Each tier, excluding Rx1, requires a prior authorization, quantity limit and/or step therapy. Here is the trade-off.  While the lower three tiers feature the common escalating scale of copayments, the top level (Rx1) is free for members; no out-of-pocket expense.  Keep in mind, the average cost of a 30-day supply of products on the 2nd tier is $1,000.

Shift Administration of Specialty Drugs from the Medical Plan to the Pharmacy Program.  It can be challenging for employers to estimate their spending on specialty drugs because these drugs are sometimes billed through medical benefits and other times billed through PBMs.  The inconsistency makes it difficult to forecast how much is being spent on specialty pharmaceuticals.

 
When employers move the administration of specialty drugs from the medical plan to the pharmacy program, they can take advantage of better cost and care measurement.  For example, instead of a doctor ordering and dispensing a specialty drug in their office and billing it as a medical benefit, a prescription drug program can better manage the drug’s cost and patient’s care.


Ax Your Pharmacy Benefit Manager.  Far too many employers fear that they do not have the human capital or time to make a PBM change.  Some worry a transition will lead to disruption among employees, but the alternative could be much worse resulting in dire consequences.  Given the perceived complexity of the PBM industry, it is easy to buy into this mindset. 

By 2020, prescription drug spending will reach $400 billion annually; employers will carry much of the costs.  Transitioning to a new PBM does not inevitably equal disruption for employers or their employees.  However, minimizing or eliminating disruption requires that you work with a proper PBM. 

If your PBM is not giving you what you need in terms of service or savings — make the change. Plan sponsors who are aware of imprudent PBM practices run an enormous risk by dealing with them.  Those who claim that they are not aware of such practices (e.g., regarding the creation of formulary and drug pricing) should not be excused. 

In conclusion, all forms of remuneration received from PBMs should be disclosed and justifiable with respect to the level of services rendered.  All compensation paid to PBMs should be reasonable.  To the contrary, it is not a stress-free, simple solution to remain with the same PBM.

Reference Pricing: “Net” Ingredient Cost for Top Selling Generic and Brand Prescription Drugs

Why is this document important?  Healthcare marketers are aggressively pursuing new revenue streams to augment lower reimbursements provided under PPACA. Prescription drugs, particularly specialty, are key drivers in the growth strategies of PBMs, TPAs and MCOs pursuant to healthcare reform. 

The costs shared below are what our pharmacy actually pays; not AWP, MAC or WAC. The bottom line; payers must have access to “reference pricing.” Apply this knowledge to hold PBMs accountable and lower plan expenditures for stakeholders.

How to Determine if Your Company [or Client] is Overpaying

Step #1:  Obtain a price list for generic prescription drugs from your broker, TPA, ASO or PBM every month.


Step #2:  In addition, request an electronic copy of all your prescription transactions (claims) for the billing cycle which coincides with the date of your price list.

Step #3:  Compare approximately 10 to 20 prescription claims against the price list to confirm contract agreement.  It’s impractical to verify all claims, but 10 is a sample size large enough to extract some good assumptions.

Step #4:  Now take it one step further. Check what your organization has paid, for prescription drugs, against our pharmacy cost then determine if a problem exists. When there is a 5% or more price differential (paid versus actual cost) we consider this a problem.

 
Multiple price differential discoveries means that your organization or client is likely overpaying. REPEAT these steps once per month.
 
— Tip —
 
Always include a semi-annual market check in your PBM contract language. Market checks provide each payer the ability, during the contract, to determine if better pricing is available in the marketplace compared to what the client is currently receiving. 

When better pricing is discovered the contract language should stipulate the client be indemnified. Do not allow the PBM to limit the market check language to a similar size client, benefit design and/or drug utilization.  In this case, the market check language is effectually meaningless.
 

Do you want to eliminate overpayments to PBMs now? The fastest path to pharmacy benefits cost containment starts here.

125 Things to Know About the ‘Big 5’ Insurers

BlueCross BlueShield

Company basics

1. Blue Cross was founded in 1929 as a way to provide prepaid hospital care. A decade later, Blue Shield was founded to provide reimbursement for physician services. The Blue Cross Association and National Association of Blue Shield Plans merged in 1982 to form the Blue Cross and Blue
Shield Association.

2. Scott Serota currently leads BCBSA as president and CEO. He has held this position since 2000, following terms as COO, a senior executive and executive vice president for system development. He previously served as president and CEO of Chicago-based Rush Prudential Health Plans, which was sold to WellPoint Health Networks in 2000.

3. The BCBS system offers a full spectrum of healthcare coverage, including coverage for large employer groups, small businesses and individuals, as well as Medicaid and Medicare plans.

4. One in three Americans — 106 million — are BCBS beneficiaries. BCBS companies also hold the largest privately underwritten health insurance contract in the world through the Federal Employee Program, or the Federal Employee Health Benefits Program, which insures more than half — 5.3 million — of federal government employees, dependents and retirees, according to the payer. BCBS provides 52 million Medicaid and 42 million Medicare beneficiaries with healthcare coverage as well.

5. BCBS companies operate in every U.S. state, the District of Columbia and Puerto Rico.

6. The Blues are entirely independent and license one or both of Blue Cross and Blue Shield’s brands to operate in distinct markets across the country. Of the 36 BCBS companies, the largest is the publicly-traded Anthem, which stretches across 14 states, and includes Rocky Mountain Hospital and Medical Service (Colorado and Nevada), Anthem Health Plans (Connecticut), BCBS of Georgia, BCBS Healthcare Plan of Georgia, Anthem Insurance Companies (Indiana), Anthem Health Plans of Kentucky, Anthem Health Plans of Maine, RightCHOICE Managed Care (Missouri), Healthy Alliance Life Insurance Co. (Missouri), HMO Missouri, Anthem Health Plans of New Hampshire, Community Insurance Co. (Ohio), Anthem Health Plans of Virginia, BCBS of Wisconsin.

Health Care Service Corp., CareFirst, The Regence Group and Highmark also serve multiple states. Health Care Service Corp. operates the following plans: BCBS of Illinois, BCBS of Montana, BCBS of New Mexico, BCBS of Oklahoma and BCBS of Texas. CareFirst includes CareFirst of Maryland, CareFirst BlueChoice and Group Hospitalization Medical Services. The Regence Group includes Regence BlueShield of Idaho, Regence BCBS of Oregon, Regence BCBS of Utah and Regence Blue Shield (Washington). Highmark includes Highmark BCBS (Pennsylvania), Highmark Blue Shield (Pennsylvania), Highmark BCBS West Virginia and Highmark BCBS Delaware.

Finances

7. Chicago-based Health Care Service Corp., a BCBS licensee and the largest nonprofit health insurer in the country, posted a $281.9 million loss in 2014, compared to a $684.3 million surplus the year before, due to a significant increase in the number of medical claims as a result of the Patient Protection and Affordable Care Act and people gaining insurance coverage through the exchanges.

8. Anthem, the largest BCBS company, reported better-than-expected profits for the first quarter of 2015, posting a net income of $856.2 million, up from $701 million for the first quarter last year.

9. The nonprofit status of some Blues outfits has been a point of contention. While some companies are publicly traded, such as Anthem, others have maintained a nonprofit status. Blue Shield of California was stripped of its state tax-exempt status in August 2014, but the news was announced this March. The California Franchise Tax Board revoked its status, which the payer has held since it was founded in 1939, after a state audit. Though no information has been released, the tax-exempt status was likely removed because Blue Shield of California was holding $4.2 billion in its financial reserves, which is four times larger than BCBSA requires its members to hold to pay claims, according to NPR. The company has contributed $325 million to its charitable foundation in the last 10 years.

10. Many payers, including BCBS plans, requested double-digit rate increases for plans created under the PPACA next year to cover the medical costs of the newly insured. Blues plans in Maryland, New Mexico and Tennessee all requested increases of 30 percent or more, and BCBS Illinois requested a 23.4 percent increase for individual plans and a 29.1 percent increase for an HMO plan, according to Politico. BCBS of North Carolina is asking for a 25.7 percent increase in premiums, according to Triad Business Journal. The increased rates have not yet been approved.

Value-based programs

11. The Blues collectively boosted value-based care spending to $71 billion in 2014, reflecting a 9 percent increase in claims tied to value-based programs since 2013.

12. Patient-centered BCBS programs generated $1 billion in savings in 2013, according to BCBSA. The portfolio includes accountable care organizations, patient-centered medical homes and other programs for a total of 570 patient-centered care programs for more than 25 million customers and 228,000 physicians.

13. BCBS has launched 450 ACOs across 32 states with more than 111,000 physicians.

14. The Blues host 69 PCMHs in 43 states and Washington, D.C. More than 56,000 physicians participate in the payer’s PCMH models.

The BCBS antitrust lawsuits

15. Two federal antitrust lawsuits against all BCBS companies and BCBSA have recently grabbed headlines. The lawsuits allege BCBS insurers’ “cartel-like” operations limit competition and drive up premiums.

16. One case was brought on behalf of healthcare providers and the other on behalf of individual and small-employer customers. The suits were combined into one claim by a federal judicial panel in Alabama and the plaintiffs are now seeking class-action status.

17. BCBS denied the allegations. It says their licensing model — which gives companies exclusive rights to use the BCBS brand in specific regions — is not unlawful and has been in existence for decades without previous antitrust action.

18. The case comes down to the judicial interpretation of the BCBS model. Whether BCBS is a franchise or was purposefully designed to reduce competition is the crux of the case, according to Barak D. Richman, a Duke law professor.

19. The plaintiffs have conflicting interests. Glenn Melnick, a professor at the University of Southern California, pointed out in The Wall Street Journal that higher reimbursement rates are of interest for providers, but would lead to higher premiums for customers.

20. No judgments have been made on the merits of the case, but it was not dismissed last year by U.S. District Judge R. David Proctor, who said the plaintiffs “have alleged a viable market-allocation scheme.”

Rankings, disputes and news

21. According to athenahealth’s annual PayerView report, the Blues have the strongest presence in the Top 10 Performers, with BCBS Washington Regence, BCBS Maryland, BCBS Louisiana, BCBS Pennsylvania Capital BlueCross, BCBS North Carolina and BCBS North Carolina Blue Medicare holding six spots. Payers were ranked based on metrics such as days in accounts receivable, claim resolution rate, denial rate and more.

22. BCBS plans were rated the No.1 plan for overall member satisfaction for the Heartland region — which includes Arkansas, Iowa, Kansas, Missouri, Nebraska and Oklahoma — and the Illinois-Indiana region, Ohio, New Hampshire, Pennsylvania and Texas, where it tied for No. 1 with UnitedHealthcare, according to the annual J.D. Power Member Health Plan Study. The study is based on consumer responses in six categories: coverage and benefits, provider choice, information and communication, claims processing, cost and customer service.

23. CareFirst BCBS announced in May it was the victim of a cyberattack that potentially compromised the data of almost one-third of its customers — 1.1 million members — making it the third hacking discovered at a BCBS company since the beginning of the year. Anthem also announced a breach in February this year, putting information at risk for approximately 80 million former and current customers and employees. A cyberattack reported in March at Premera Blue Cross compromised the data of 11 million customers.

24. Pittsburgh-based UPMC and Highmark have been embroiled in a dispute since 2011, when the payer moved to acquire West Penn Allegheny Health System, UPMC’s biggest competitor. In response, UPMC decided not to renew its contract with the payer, forcing Highmark customers to seek care outside of the system or pay out-of-network fees. Most recently, a judge ordered UPMC to continue to provide in-network access to Highmark Medicare Advantage members until 2019, or the duration of the consent decree the companies entered into in June 2014.

25. BCBSA announced in April plans to launch a private health insurance exchange to help transition Medicare-eligible retirees from group health benefits to individual Medicare coverage. The exchange will offer supplemental Medicare insurance, or Medigap, as well as Medicare Advantage and Medicare Part D plans.

Blue Cross plans, state by state
Alabama: Blue Cross and Blue Shield
Alaska: Premera Blue Cross Blue Shield
Arizona: Blue Cross and Blue Shield
Arkansas: Blue Cross and Blue Shield
California: Anthem Blue Cross; Blue Shield
Colorado: Anthem Blue Cross and Blue Shield
Connecticut: Anthem Blue Cross and Blue Shield
Delaware: Highmark Blue Cross Blue Shield
District of Columbia: CareFirst Blue Cross Blue Shield
Florida: Blue Cross and Blue Shield
Georgia: Blue Cross and Blue Shield
Hawaii: Blue Cross Blue Shield of Hawaii
Idaho: Blue Cross; Regence BlueShield of Idaho
Illinois: Blue Cross and Blue Shield
Indiana: Anthem Blue Cross Blue Shield
Iowa: Wellmark Blue Cross and Blue Shield
Kansas: Blue Cross and Blue Shield
Kentucky: Anthem Blue Cross and Blue Shield
Louisiana: Blue Cross and Blue Shield
Maine: Anthem Blue Cross and Blue Shield
Maryland: CareFirst Blue Cross Blue Shield
Massachusetts: Blue Cross and Blue Shield
Michigan: Blue Cross and Blue Shield
Minnesota: Blue Cross and Blue Shield
Mississippi: Blue Cross and Blue Shield
Missouri: Anthem Blue Cross Blue Shield; BlueCross and BlueShield of Kansas City
Montana: Blue Cross and Blue Shield
Nebraska: Blue Cross and Blue Shield
Nevada: Anthem Blue Cross and Blue Shield
New Hampshire: Anthem Blue Cross and Blue Shield
New Jersey: Horizon Blue Cross and Blue Shield
New Mexico: Blue Cross and Blue Shield
New York: BlueCross & BlueShield of Western; BlueShield of Northeastern; Empire Blue Cross and Blue Shield; Excellus BlueCross BlueShield
North Carolina: Blue Cross and Blue Shield
North Dakota: Blue Cross and Blue Shield
Ohio: Anthem Blue Cross and Blue Shield
Oklahoma: Blue Cross and Blue Shield
Oregon: Regence BlueCross BlueShield of Oregon
Pennsylvania: Highmark Blue Shield; Capital BlueCross (Harrisburg); Highmark Blue Cross Blue Shield (Pittsburgh); Independence Blue Cross (Philadelphia)
Puerto Rico: BlueCross BlueShield of Puerto Rico
Rhode Island: Blue Cross and Blue Shield
South Carolina: Blue Cross and Blue Shield
South Dakota: Wellmark Blue Cross and Blue Shield
Tennessee: Blue Cross and Blue Shield
Texas: Blue Cross and Blue Shield
Utah: Regence BlueCross BlueShield of Utah
Vermont: Blue Cross and Blue Shield
Virginia: Anthem Blue Cross and Blue Shield and CareFirst BlueCross BlueShield
Washington: Premera Blue Cross; Regence BlueShield
West Virginia: Highmark Blue Cross Blue Shield West Virginia
Wisconsin: Anthem Blue Cross and Blue Shield
Wyoming: Blue Cross and Blue Shield

Click here to learn about the remaining ‘Big Five’ insurers.

Reference Pricing: Pharmacy Invoice Cost (ACTUAL) for Top Selling Generic and Brand Prescription Drugs

Why is this document important?  Healthcare marketers are aggressively pursuing new revenue streams to augment lower reimbursements provided under PPACA. Prescription drugs, particularly specialty, are key drivers in the growth strategies of PBMs, TPAs and MCOs pursuant to healthcare reform. 

The costs shared below are what our pharmacy actually pays; not AWP, MAC or WAC. The bottom line; payers must have access to “reference pricing.” Apply this knowledge to hold PBMs accountable and lower plan expenditures for stakeholders.

How to Determine if Your Company [or Client] is Overpaying

Step #1:  Obtain a price list for generic prescription drugs from your broker, TPA, ASO or PBM every month.


Step #2:  In addition, request an electronic copy of all your prescription transactions (claims) for the billing cycle which coincides with the date of your price list.

Step #3:  Compare approximately 10 to 20 prescription claims against the price list to confirm contract agreement.  It’s impractical to verify all claims, but 10 is a sample size large enough to extract some good assumptions.

Step #4:  Now take it one step further. Check what your organization has paid, for prescription drugs, against our pharmacy cost then determine if a problem exists. When there is a 5% or more price differential (paid versus actual cost) we consider this a problem.

 
Multiple price differential discoveries means that your organization or client is likely overpaying. REPEAT these steps once per month.
 
— Tip —
 
Always include a semi-annual market check in your PBM contract language. Market checks provide each payer the ability, during the contract, to determine if better pricing is available in the marketplace compared to what the client is currently receiving. 

When better pricing is discovered the contract language should stipulate the client be indemnified. Do not allow the PBM to limit the market check language to a similar size client, benefit design and/or drug utilization.  In this case, the market check language is effectually meaningless.
 

Do you want to eliminate overpayments to PBMs now? The fastest path to pharmacy benefits cost containment starts here.