Prescription Drug Prices: 10 Definitions All Payers $hould Know

Acquisition Cost is defined as the invoice price to the pharmacy for a prescription drug dispensed to a patient, minus the amount of all discounts and other cost reductions attributable to such dispensed drug.

Average Manufacturer Price (AMP) is the average price paid to the manufacturer for the drug in the United States by wholesalers for drugs distributed to retail community pharmacies and by retail community pharmacies that purchase drugs directly from the manufacturer. The health reform law excludes payments and rebates or discounts provided to certain providers and payers from the calculation of AMP.  

In March of this year, the Affordable Care Act (ACA) again amended the legal definition of average manufacturer price (AMP). AMP uniquely serves to determine both a multiple source drug’s reimbursement amount and the rebate amounts for single source, innovator single source, and multiple source drugs within the Medicaid program. No other pricing metric serves this dual function. 

Average Sales Price (ASP) – In 2005, Medicare began to pay for most drugs using an entirely new methodology based on ASP rather than AWP. Unlike AWP and WAC, there is a specific method to calculate ASP set forth in the MMA and the Act. Section 1847A(c) of the Act, as amended by the MMA, defines ASP as a manufacturer’s unit sales of a drug to all purchasers in the United States in a calendar quarter divided by the total number of drug units sold by the manufacturer in that same quarter. 

The ASP is net of any price concessions such as volume, prompt pay, and cash discounts; free goods contingent on purchase requirements; chargebacks; and rebates other than those obtained through the Medicaid drug rebate program. Certain sales are exempt from the calculation of ASP, including sales at a nominal charge.

Average Wholesale Price (AWP) is not based on actual transactional, marketplace price data.  Despite its name and its sometime use as a price index, the published AWP is not an average of actual wholesale prices. It is not intended to represent, and cannot be assumed to reflect, actual transaction prices.  

A wholesaler or other direct purchaser from a pharmaceutical manufacturer may agree to sell its products to one or more of its customers at prices that on their face are effectively lower than the published AWP. 

AWP information does not reflect any such lower pricing that may be made available in actual purchase transactions through a variety of methods, including, but not limited to, purchase, prompt-pay or other discounts, volume or other rebates or credits, or a variety of other price reduction arrangements.

Direct Price (DP) is the price directly reported to AWP publishers by a manufacturer as the list price at which non-wholesalers and healthcare providers may purchase drug products from that manufacturer. These publishers generally do not receive a reported DP for drugs that are sold by a manufacturer exclusively through wholesalers, although in some cases both a DP and a WAC may be provided at the manufacturer’s discretion. 

DP does not represent an actual sales price in any single transaction or group of transactions between a manufacturer and a non-wholesaler or healthcare provider, as any manufacturer may agree to sell its products to one or more customers at a lower price through any number of methods, including, but not limited to, discounts, rebates, credits or other net price reduction arrangements.


Federal Supply Schedule (FSS) are prices paid to manufacturers by the VA, other federal agencies, and certain other entities, such as Indian tribal governments, are set by the Federal Supply Schedule (FSS). Under the Veterans Health Care Act of 1992, manufacturers must make drugs available to covered entities at the FSS price as a condition of eligibility for Medicaid reimbursement.  

FSS prices are negotiated with manufacturers by the VA.15 In general, the FSS price may be no higher than the lowest contractual price charged by the manufacturer to any non-federal purchaser under similar terms and conditions. In order to determine this price, manufacturers supply the VA with information on price discounts and rebates offered to different customers and the terms and conditions involved. 

Under certain conditions, the VA may accept an FSS price that is higher than the price offered to some non-federal customers. According to the GAO, average FSS prices are more than 50 percent below the non-federal average manufacturer’s price.

Ingredient Cost

  • BRAND INGREDIENT COSTS – the discount from the list price, also called the Average Wholesale Price or AWP. Typical discounts range from AWP-12% to AWP-15%. A PBM may contract with a retail pharmacy at AWP-15% and then offer you an average discount of AWP-12%, keeping the difference. This is called a “spread” or “differential pricing.” Each percentage point of withhold is worth approximately $0.60 per script.
  • GENERIC INGREDIENT COSTS – generic discounts are priced in one of two ways: (1) as an AWP discount or (2) at a Maximum Allowable Cost (MAC). There is usually a large gap between these pricing elements – about $6.40 per prescription. Ask your PBM to price out the top 50 generics used in the previous year, giving you both the list price and the discounted pricing (either MAC or AWP MAC) and disclose whether your MAC pricing is cost effective. Interestingly, PBM’s derive revenue from MAC programs by contracting with pharmacies at MAC pricing and charging you the AWP discount. This is another form of differential pricing.
Maximum Allowable Cost (MAC) list generally refers to a payer or PBM‐generated list of products that includes the upper limit or maximum amount that a plan will pay for generic drugs and brand name drugs that have generic versions available (multi‐source brands).  Essentially, no two MAC lists are alike and each PBM picks and chooses products for their MAC lists, using different criteria to derive and apply prices to the list.  

Some of the factors that PBMs consider to choose products for inclusion on a list are availability of the product in the marketplace, whether the product is obtainable from more than one manufacturer, how the product is rated by the FDA in relation to the innovator drug and price differences between the brand and generic products. However, there is no standardization in the industry as to the criteria for the inclusion of drugs on MAC lists or for the methodology as to how the maximum price is determined, changed or updated. 

Suggested Wholesale Price (SWP) is the price that a manufacturer suggests wholesalers charge when selling the manufacturer’s drug to the wholesaler’s customers, as reported by the manufacturer. The SWP does not necessarily represent the actual sales price used by a wholesaler in any specific transaction or group of transactions with its own customers. Wholesalers determine the actual prices at which they sell drug products to their respective customers, based on a variety of competitive, customer and market factors.
 

Wholesale Acquisition Cost (WAC) is the price directly reported to publishers, like Wolters Kluwer Health, by a manufacturer as the list price at which wholesalers may purchase drug products from that manufacturer.  WAC does not represent an actual sales price in any single transaction or group of transactions between a manufacturer and a wholesaler, as any manufacturer may agree to sell its products to one or more customers at a lower price through any number of methods, including, but not limited to, discounts, rebates, credits or other net price reduction arrangements.

Click here to register for: “How To Slash the Cost of Your PBM Service, up to 50%, Without Changing Providers or Employee Benefit Levels.”

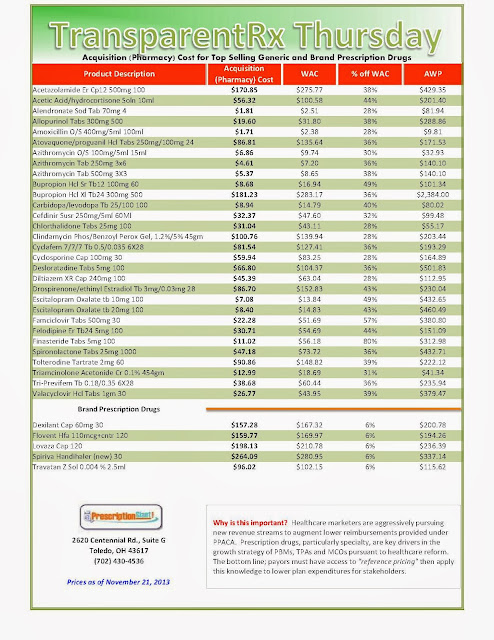
“Actual” Acquisition Costs (what pharmacy pays) of Top Selling Generic and Brand Prescription Drugs: for Payers

Why is this document important?  Healthcare marketers are aggressively pursuing new revenue streams to augment lower reimbursements provided under PPACA. Prescription drugs, particularly specialty, are key drivers in the growth strategies of PBMs, TPAs and MCOs pursuant to healthcare reform. The costs shared below are what our pharmacy actually pays; not AWP, MAC or WAC.  The bottom line; payers must have access to “reference pricing” then apply this knowledge to lower plan expenditures for stakeholders.

As of 11/21/2013 – Published Weekly on Thursdays
How to Determine if Your Company [or Client] is Overpaying
Step #1:  Obtain a price list for generic prescription drugs from your broker, TPA, ASO or PBM every month.

Step #2:  In addition, request an electronic copy of all your prescription transactions (claims) for the billing cycle which coincides with the date of your price list.

Step #3:  Compare approximately 10 to 20 prescription claims against the price list to confirm contract agreement.  It’s impractical to verify all claims, but 10 is a sample size large enough to extract some good assumptions.

Step #4:  Now take it one step further. Check what your organization has paid, for prescription drugs, against our pharmacy cost then determine if a problem exists. When there is a 10% or more price differential (paid versus actual cost) we consider this a problem.

Multiple price differential discoveries means that your organization or client is likely overpaying. REPEAT these steps once per month.

Include a semi-annual market check in your PBM contract language. Market checks provide each payer the ability, during the contract, to see if better pricing is available in the marketplace compared to what the client is currently receiving. 

When better pricing is discovered the contract language should stipulate the client be indemnified. Do not allow the PBM to limit the market check language to a similar size client, benefit design and/or drug utilization.  In this case, the market check language is effectually meaningless.

Pharmacy Benefits: Eight Ways it May Unfold in 2014

Pharmacy Benefits Managers (PBMs) are offering more complex programs and adopting data-mining tools to improve outcomes — not necessarily financial — for stakeholders.  Payers and their agents, however, continue to use antiquated tactics to alleviate the pain [cost] associated with offering pharmacy benefits; cutting benefits and increasing member cost-share.  Better planning and tougher decisions are required to rein in rising costs.

I.  Generic Drug Price Increase

While most of the country is ecstatic about the “Patent Cliff” not many payers have considered the potential negative effect on relative prices for generic prescription drugs.  It only makes sense, as competition decreases and demand increases, prices will eventually follow suit.

Furthermore, traditional PBMs will lose valuable manufacturer revenue or rebates.  Some PBMs will undoubtedly look to make up the difference thus generic drug prices, your MAC prices, will be the first stop.

In the online marketing world the key to success, in my opinion, is a relentless focus on A/B split testing.  The same is true for payers; where those whom relentlessly monitor drug costs throughout the year, making changes on the fly, minimize expenditures.  

Those payers whom more or less sign the contract, cut the check and wait for the renewal period unknowingly pay for the private corporate jets!  Find a reliable source for reference pricing and relentlessly monitor costs.        

 
II.  Drug Formulary Tier Increase
 

Specialty drugs are the fastest growing segment in the pharmaceutical supply chain.  The most common cost-share tier among our plan sponsors is three-tier — generics, preferred brands, non- preferred brands. We are starting to see the emergence of innovative cost-share structures with five or more tiers, but it is unclear whether these will become standard practice. 

The co-pay differential between tiers, in our pharmacy, continues to widen.  The difference between tier one and tier two co-pays has increased to $21 (compared to $5 about seven years ago).

III.  Fewer Employers to Offer Retiree Prescription Drug Plans
 
The percentage of employers that plan to continue offering prescription drug plans to Medicare-eligible retirees has dropped dramatically in the past two years, according to a study released May 29 by Buck Consultants L.L.C.

Fifty-five percent of employers that now provide pharmacy benefits for Medicare-eligible retirees said they plan to continue offering the benefit, down from 75 percent in the New York-based consulting firm’s 2011 survey.

Courtesy of Forbes.com
Another 33 percent of employers said they were unsure if they would continue offering prescription benefits to Medicare retirees after 2014, a significant increase from the 19 percent who were unsure in the 2011 survey.

“Employers have options for controlling prescription drug costs for Medicare-eligible participants,” Paul Burns, an Atlanta-based principal at Buck Consultants, said in a statement.

“For example, since retiree drug subsidy payments are no longer tax-exempt and do not keep pace with rising drug costs, some employers are considering moving to an employer group waiver plan to take advantage of additional subsidies available as a result of the Patient Protection and Affordable Care Act,” he said.

IV.  Medication Therapy Management: Non-traditional Method to Alter Behavior

MTM is a distinct service or group of services which optimize therapeutic outcomes for individual patients. As of 2013, MTM is approved for provision to Medicare Part D enrollees who have multiple chronic conditions (with a maximum of three plan selected chronic conditions being the lower limit), are taking multiple Part D drugs, and are likely to incur annual drug costs that exceed $3,144.  All Medicare beneficiaries who meet the above criteria as defined by each plan are automatically eligible to receive MTM services unless they voluntarily opt-out.

On the other hand, the provision of MTM services to non-Medicare enrollees by commercial health plans is less defined. Each plan has the liberty to devise different eligibility requirements together with different MTM service component which makes cross-program comparisons in such a heterogeneous environment quite difficult.  

Supporters of MTM (professional pharmacy societies, policy experts, etc.) would like to show health decision makers that tracking and evaluating MTM services outputs using Current Procedural Terminology (CPT) codes (approved as Category I codes in 2008) that MTM services result in better health outcomes cost reductions and positive return on investment in patients that need better medication management.

V.  Health Exchanges; Private and Public By Tom Norton

Even though the specifics of how PBMs under Obamacare will operate are unknown, I was told by many that if you want to understand how this new Obamacare PBM market is likely to play out, you should look to other insurance markets for insight. 

In particular, they said, the PBM operations in the Medicare Part D marketplace and even more to the point, the Rx services being offered by PBMs in the new private health exchanges, will provide a sense of the PBM offerings to be provided in Obamacare.

Perhaps an even more important PBM real world example is what is going on right now in the private health exchange environment. This is because it closely resembles the insurance concept planned for Obamacare.

Over the past few months, several large companies (Walgreens, IBM, GE, and others) have announced that they are moving their employees out of “defined benefit” health insurance plans, and placing them into “defined contribution” programs. This will be accomplished by utilizing private health exchanges. What exactly are these exchanges?

Private health exchanges have several different models. Some provide “self insured” programs to provide healthcare to individuals, while most offer group health insurance to employers under “fully insured” programs. The objective of both is to reduce the cost of healthcare to the employer.

This approach differs from today’s “defined benefit” insurance plans in which the PBMs are frequently “carved out” of the general health benefit and stand alone as separate services. PBMs do save the insurer money in this environment, but it’s thought they could save more if they were “carved in” to the insurance offering.

 
VI.  Self-Insured vs. Fully-Insured

I have noticed a trend in the PBM industry where self-insured organizations like employers and unions are making the transition to all-cash programs. Although I’m unsure to all the reasons for the change, one thing is clear and that is at least part of the change is due to the uncertainty provided by PPACA. Payers want to have control and relinquishing it is a scary proposition.

VII.  Limited Pharmacy Networks
After cost-sharing, establishing pharmacy networks has been a popular approach to cost management. Limited pharmacy networks, not talked of much before 2010, are more of a consideration after the contract dispute between Walgreens and Express Scripts.  
 

Providing the broadest access to members may no longer trump the more favorable pricing of a narrowed network.  A large and growing supply of retail pharmacies makes the limited network approach possible.  

VIII.  Specialty Drugs

Payers continue to be challenged by rapidly rising prescription drug costs, particularly specialty drugs.  However, traditional [and some transparent] Pharmacy Benefit Managers offer the same elixir for controlling these costs as they did a decade ago: increase patient use of mail-order, use of preferred or narrow pharmacy networks, a formulary design which promotes preferred drugs, reduce patient co-share for better outcomes.

While the aforementioned tactics do assist in controlling costs, they’re standard practice and are not the aggressive measures necessary to help reduce or control spending.  Payers should hire fiduciary PBMs – those legally obligated to truly put clients and their members first; before shareholders and profitability.

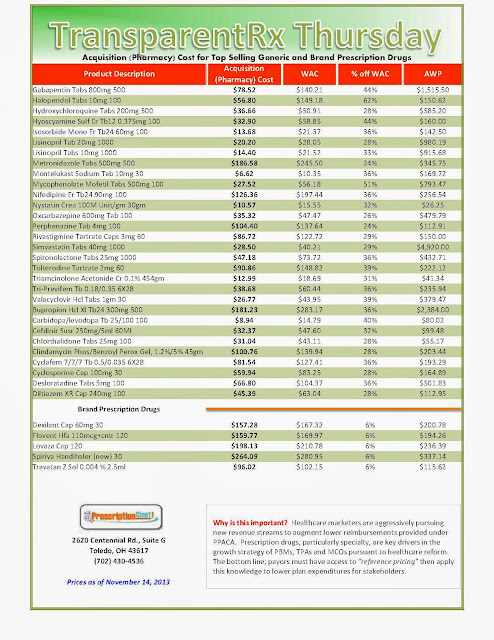
“Actual” Acquisition Costs (what pharmacy pays) of Top Selling Generic and Brand Prescription Drugs: for Payers

Why is this document important?  Healthcare marketers are aggressively pursuing new revenue streams to augment lower reimbursements provided under PPACA. Prescription drugs, particularly specialty, are key drivers in the growth strategies of PBMs, TPAs and MCOs pursuant to healthcare reform. The costs shared below are what our pharmacy actually pays; not AWP, MAC or WAC.  The bottom line; payers must have access to “reference pricing” then apply this knowledge to lower plan expenditures for stakeholders.

As of 11/14/2013 – Published Weekly on Thursdays

How to Determine if Your Company [or Client] is Overpaying
Step #1:  Obtain a price list for generic prescription drugs from your broker, TPA, ASO or PBM every month.

Step #2:  In addition, request an electronic copy of all your prescription transactions (claims) for the billing cycle which coincides with the date of your price list.

Step #3:  Compare approximately 10 to 20 prescription claims against the price list to confirm contract agreement.  It’s impractical to verify all claims, but 10 is a sample size large enough to extract some good assumptions.

Step #4:  Now take it one step further. Check what your organization has paid, for prescription drugs, against our pharmacy cost then determine if a problem exists. When there is a 10% or more price differential (paid versus actual cost) we consider this a problem.

Multiple price differential discoveries means that your organization or client is likely overpaying. REPEAT these steps once per month.

Include a semi-annual market check in your PBM contract language. Market checks provide each payer the ability, during the contract, to see if better pricing is available in the marketplace compared to what the client is currently receiving. 

When better pricing is discovered the contract language should stipulate the client be indemnified. Do not allow the PBM to limit the market check language to a similar size client, benefit design and/or drug utilization.  In this case, the market check language is effectually meaningless.


The Next BIG Thing in Prescription Drugs is in Your Pocket!

With the huge generic cliff we have just experienced in prescriptions drugs and plans experiencing 80 percent generic drug use, you would think that the days of the double digit increases in the cost of prescription drugs is over. But many experts tell us that we need to brace ourselves for the over 400 bio-technically developed specialty drugs on the market with therapies of over $100,000 a year. So the question for 2014 now becomes: “How can I get my employees or members of my health plan to choose wisely when selecting drugs and get the most out of those drugs with the looming high cost drugs replacing older therapies?”
Background
Until very recently, the cost of the entire prescription drug transaction was hidden from both the employer and employee. In some cases, it still is. For plans under traditional programs with their pharmacy benefit manager (PBM), the pharmacy is reimbursed a lower amount and a higher amount is charged to the plan for the same transaction, with the PBM taking the undisclosed “spread” in the deal as its administration fee. This type of pricing arrangement leaves little for plans trying to create a sense of consumerism, meaning plans that encourage patients to be more responsible consumers of health care dollars through high front-end deductibles or percentage co-insurance. If it is difficult for the employer to know the true cost of a prescription drug, then how should the patient to be expected to know the cost, and then have the means and access to that information allowing better consumerism of prescription drugs?
A new day has dawned. More and more PBMs are being forced to offer transparent and pass-through deals where the pharmacy is reimbursed exactly what the plan sponsor pays and the plan sponsor reimburses the PBM for its services through a reasonable and fully disclosed administration fee. With this new day and new way of doing things, PBMs have now created mobile applications that assist patients in making smart decisions – when and where they need to make them – to be smarter and better consumers.
The 2014 Mobile Environment
The new best weapon to control prescription drug spend is sitting in your employees’ pocket or purse: their smartphone. Research reveals members want more savings and better service. In a 2010 survey of 15 health plans conducted by InfoAlchemy, members are confused by how health care is priced, eight of out ten members want mobile health care applications, member engagement through mobile is 400 percent higher than traditional internet applications and lastly, showing local options helps to reduce cost. According to new research from the Pew Research Center’s Internet & American Life Project, 61 percent of Americans own a smartphone. Many still own a regular cellphone with 91 percent of the adult population owning some sort of mobile phone. But the jump in smartphone owners is substantial.
According to Pew’s previous reports, in May 2011, 35 percent of Americans owned smartphones, while in February 2012, 46 percent owned a more powerful phone. The conclusion to draw from this is that from a health care perspective, members need more and more timely information and many of plans’ members own the information gateway in their pocket. Benefit managers’ challenge is to connect the dots – provide members the information that they want and when and where they want the information, all at a low-cost investment. And they can now do so by collecting a simple 10-digit number.
Options are Available
Up to now, PBM mobile apps have been nothing more than what you could obtain over the internet through the PBM’s website. These dinosaurs of mobile apps allowed the member to find a pharmacy or look up the general cost difference between brand and generic alternatives. But since few members drive to the pharmacy with a computer in the car, these simplistic tools did nothing to provide the information when the member needed it.
New apps are now available through some leading-edge PBMs and a stand-alone application that can purchased and layered on to any willing PBM’s program (i.e. transparent program). There are many applications available and this article only highlights three of the many very good options.
One that is really revolutionary is a program called Medvana. Medvana is a free application that allows the patient to “auction” its prescription at point-of-service to provide the lowest cost option compared to the distance the member is willing to go to get the prescription. Pricing under this program is not an estimate. It is a real-time adjudicated price that reflects the contracted rate for that drug at a particular pharmacy. In contrast, other similar programs offer an approximation or “guesstimate” of what the consumer can expect be charged.
When the estimate is lower than the price the pharmacy actually charges the user, it causes confusion and a loss of trust with users. With Medvana, users have high confidence that the price displayed is the price the pharmacy will charge and can push back on the pharmacy with authority if a higher price is presented to them. The program also provides quick access to alternative drugs that might cost less and yet are clinically effective. Users can quickly review the prices of other drugs in the therapeutic category so that the patient can request their doctor switch them to the lowest cost option. The value to plan sponsors, of course, is…to continue reading click here.
By Susan Hayes, Principal, Pharmacy Outcomes Specialists

“Actual” Acquisition Costs (what pharmacy pays) of Top Selling Generic and Brand Prescription Drugs for Payers

Why is this document important?  Healthcare marketers are aggressively pursuing new revenue streams to augment lower reimbursements provided under PPACA. Prescription drugs, particularly specialty, are key drivers in the growth strategies of PBMs, TPAs and MCOs pursuant to healthcare reform. The costs shared below are what our pharmacy actually pays; not AWP, MAC or WAC.  The bottom line; payers must have access to “reference pricing” then apply this knowledge to lower plan expenditures for stakeholders.

As of 11/07/2013 – Published Weekly on Thursdays

How to Determine if Your Company [or Client] is Overpaying
Step #1:  Obtain a price list for generic prescription drugs from your broker, TPA, ASO or PBM every month.

Step #2:  In addition, request an electronic copy of all your prescription transactions (claims) for the billing cycle which coincides with the date of your price list.

Step #3:  Compare approximately 10 to 20 prescription claims against the price list to confirm contract agreement.  It’s impractical to verify all claims, but 10 is a sample size large enough to extract some good assumptions.

Step #4:  Now take it one step further. Check what your organization has paid, for prescription drugs, against our pharmacy cost then determine if a problem exists. When there is a 10% or more price differential (paid versus actual cost) we consider this a problem.

Multiple price differential discoveries means that your organization or client is likely overpaying. REPEAT these steps once per month.

Include a semi-annual market check in your PBM contract language. Market checks provide each payer the ability, during the contract, to see if better pricing is available in the marketplace compared to what the client is currently receiving. 

When better pricing is discovered the contract language should stipulate the client be indemnified. Do not allow the PBM to limit the market check language to a similar size client, benefit design and/or drug utilization.  In this case, the market check language is effectually meaningless.

Hospital helps patients manage medications, even after hospital stay

The New York Times reported that nearly one in five Medicare patients returned to the hospital within 30 days of their initial discharge. In that first month, the patient has to begin a transition back into their regular routine, along with the application of their newly gained post-discharge treatment. These initial 30 days can reflect not only the quality of the care received at the hospital, but also the education provided to the patient in reference to their medication and can greatly affect their recovery.
For the past two years, Mercy Philadelphia Hospital has teamed up with SunRay Drugs, the Philadelphia College of Pharmacy at the University of Sciences, and Keystone First insurance provider, in order to enhance the progression of care from the hospital to home, particularly in the area of medication management so as to prevent hospital readmission.
This bond of organizations not only works together to dissolve the gap between home and the hospital, but also provide an even greater opportunity to further educate the patients enrolled in this program. From this opportunity, a direct correlation has been seen in readmission rates. As the patient’s medication knowledge is increased, their likelihood of being readmitted to the hospital can decrease.

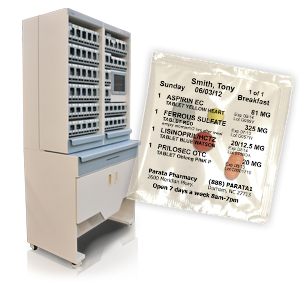
Compliance Packaging:  Integral part of any good MTM program
Patients that are at a higher risk of readmission are identified and offered enrollment in a medication therapy management (MTM) with SunRay Drugs and the University of Sciences. Through these MTMs, clinical pharmacists uncover the patients’ individual drug therapy problems and work to adjust them. Follow-up appointments give the enrollee an opportunity to grasp a clearer concept of their medication, and assist in giving them the information they need in order to stay out of the hospital.
Mercy Philadelphia Hospital’s Director of Care Coordination Austin Reed and Clinical Pharmacy Coordinator Tom Turco are two key players in this initiative. They are aware of how vital the first 30 days of a patient’s discharge can be to a patient’s short and long-term future. The two also know that the involvement of family members often plays a major part in a patient having a smooth recovery process.
“The families are often the caregivers,” says Turco. “They handle affairs, and in some cases, may be more involved in the details of a patient’s medication, than the patients themselves.”
“We have completely changed our care coordination model in order to better suit the needs of patients. In addition to that, we have been working with other hospitals that are using similar systems, in order to increase our system’s efficiency as well, “says Reed.
“It is crucial that they are well-educated on how to manage their medications,” Turco says in reference to high-risk patients, most notably those that take numerous medications, those with difficulty accessing medications, patients with co-morbid conditions, and the elderly.
In these cases, medication compliance is key in a smooth healing process. The obstruction of one’s treatment can result in complications, morbidity, mortality, and increased healthcare costs. Factors such as low literacy or lack of health insurance coverage can be major causes of unsuccessful medication compliance. As a result, a greater chance of readmission may occur.
Mercy Philadelphia Executive Director Susan Cusack believes that with this connection, the level of care provided will reach an even higher level of efficiency. Cusack states that the patients now have more convenient sources in which they can receive their medication, and also meet with pharmacists.
“This partnership with external sources is vital. It demonstrates that here at Mercy Philadelphia Hospital, we care about our patients, not only when they are in our care, but even after their discharge.”
Since starting the program, Mercy Philadelphia Hospital’s 30-day readmission rates have dropped from 13.8-20.5 percent in January 2011 to July 2012, to 12.9-17.7 percent from November 2012 to February 2013. On a steady decline, the goal of the program is to have a readmission rate of less than 15 percent by the end of 2013.
To learn more about Mercy Health System, visit www.mercyhealth.org.
Read the full story:  By Haywood Brewster