Shocker: CVS Allegedly Overcharged Employers (Payers) for Prescription Drugs

An important point to make here is that consumers aren’t concerned with how much a drug costs if their responsibility (cost share) is only a $5 or $10 copay. The reason CVS and other legacy PBMs get away with such an opaque practice lies squarely on the shoulders of payers. These payers include health insurance companies, self-funded employers, MCOs, unions, and government entities, for example.  Watch the video below.

Well there was a video, but I suspect CVS flexed its muscle and now there isn’t a trace of it. Mail-order pharmacy services too may not deliver the cost savings promised during the sales pitch which won the legacy PBM your business. In fact, this practice of overcharging is a notorious cash cow for so called transparent or pass-through pricing PBMs whom offer prescriptions via mail-order pharmacy.  Think about it…their first priority is shareholder return on equity not eliminating overpayments from clients.

No matter what you’re being told – your PBM is not fully transparent unless it provides a fiduciary standard of care. Most pharmacy benefit managers will overcharge its clients at every available opportunity. Unless of course the PBM offers a fiduciary standard of care and commits to it in writing.

Instead of the typical fee-for-service contract obtain a fiduciary contract which guarantees “net” ingredient cost for prescription drugs dispensed as part of your prescription drug plan. Better yet, create your own fiduciary contract and put it out for bid vis-à-vis a reverse auction. See my earlier blog post, “Time to Blow Up Your PBM Strategy” to learn more about reverse auctions.

Employers pay a higher admin fee with fiduciary contracts, but in the end total costs are significantly reduced. Furthermore, the price paid is completely transparent; there are no [legal] hidden fees. Of course, none of what I’m writing will make much difference if your PBM team is not well-trained or indifferent to change.

Reference Pricing: “Net” Ingredient Cost for Top Selling Generic and Brand Prescription Drugs

Why is this document important?  Healthcare marketers are aggressively pursuing new revenue streams to augment lower reimbursements provided under PPACA. Prescription drugs, particularly specialty, are key drivers in the growth strategies of PBMs, TPAs and MCOs pursuant to healthcare reform. 

The costs shared below are what our pharmacy actually pays; not AWP, MAC or WAC. The bottom line; payers must have access to “reference pricing.” Apply this knowledge to hold PBMs accountable and lower plan expenditures for stakeholders.

How to Determine if Your Company [or Client] is Overpaying


Step #1:  Obtain a price list for generic prescription drugs from your broker, TPA, ASO or PBM every month.


Step #2:  In addition, request an electronic copy of all your prescription transactions (claims) for the billing cycle which coincides with the date of your price list.

Step #3:  Compare approximately 10 to 20 prescription claims against the price list to confirm contract agreement.  It’s impractical to verify all claims, but 10 is a sample size large enough to extract some good assumptions.

Step #4:  Now take it one step further. Check what your organization has paid, for prescription drugs, against our pharmacy cost then determine if a problem exists. When there is a 5% or more price differential (paid versus actual cost) we consider this a problem.

 
Multiple price differential discoveries means that your organization or client is likely overpaying. REPEAT these steps once per month.
 
Always include a semi-annual market check in your PBM contract language. Market checks provide each payer the ability, during the contract, to determine if better pricing is available in the marketplace compared to what the client is currently receiving.

When better pricing is discovered the contract language should stipulate the client be indemnified. Do not allow the PBM to limit the market check language to a similar size client, benefit design and/or drug utilization.  In this case, the market check language is effectually meaningless.

Employers Use of Multi-Tier Pharmacy Benefits Continues to Rise

Most employers have been using multi-tier prescription drug plans for many years, but new data released from the 2014 UBA Health Plan Survey shows a significant increase in the use of 4-tier plans, which typically cover the highest cost drugs, as well as major increases in corresponding median copays — a trend that is expected to continue, according to UBA.
UBA’s survey finds that, since 2009, the number of 4-tier plans has grown from 13.6 percent to 32.9 percent of all plans offered, a 141.9 percent increase. Since 2012, tier 4 median copays have also grown 25 percent; in 2014, 4-tier plans had median copays of $10, $35, $55 and $100.
“There may be future shifts in these copays since prescription copays and deductibles must track to out-of-pocket maximums under the Patient Protection and Affordable Care Act (ACA),” says Mark Bagnall, CEO of BAGNALL. “However, general competitive pressure will demand that employees contribute more for the highest tiers.”
UBA expects that specialty drug costs will continue to drive the maximum possible copay increases in this tier. “Not only must copays cover the rising costs of these drugs driven by the pharmaceutical industry but they must cover the merging physician commissions given for some specialty drugs,” says Mike Mulqueeney, VP, Johnson & Dugan Insurance Services Corporation.
“We’re already seeing some employers using a 6- or even 7-tier drug plan,” says Carol Taylor, Employee Benefit Advisor, D & S Agency. “When you have an employee taking a drug that costs $30,000 a month, a $100 copay is not sustainable. Eventually, we’ll reach a point where the insurers won’t be able to recoup the cost of prescription drug cost increases. Because of the out-of-pocket maximums in place by the ACA, the only way to offset the increased prescription drug costs will be through higher premium increases.”
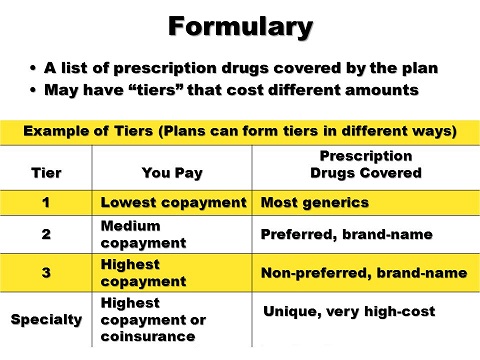
According to UBA’s survey, 57.1 percent of all prescription drug plans utilize three tiers (generic, formulary brand, and non-formulary brand), 6.8 percent retain a 2-tier plan, and 32.9 percent offer four tiers or more. In five years (since 2009), the number of 3-tier plans has decreased 20.4 percent (from 71.7 percent to 57.1 percent) and 2-tier plans have decreased 45.6 percent (from 12.5 percent to 6.8 percent) in that same time period.
PRESCRIPTION DRUG PLAN TIER PREVALENCE BY EMPLOYER SIZE
  •  Employer size with the most 3-tier plans: employers with 500 to 999 employees (70%)
  •  Employer size with the least 3-tier plans: employers with fewer than 10 employees (48.2%)
  •  Employer size with the most 4-tier plans: employers with 10 to 24 employees (40%)
  •  Employer size with the least 4-tier plans: employers with 500 to 999 employees (20%)
“Employers with 500 to 999 employees haven’t had to go with 4-tier plans yet. These groups are truly experience rated and need to keep a constant eye on their loss ratio. Because prescription costs are increasing at a very rapid pace, and new, much more expensive, drugs are coming to the market they will be forced to look at adding a fourth and maybe even a fifth tier,” says Vicki Ferentz, Vice President, Acadia Benefits, Inc.
COPAY DESIGN
A majority (67.8 percent) of prescription drug plans utilize copays. Many used to offer copay only; in the last five years, however, most plans required the patient to pay coinsurance after the copay. UBA’s survey shows that, since 2010, the number of 2-tier plans with a prescription copay only (no coinsurance) decreased 42.9 percent, and the number of 3-tier plans with a copay only decreased 20.6 percent.

Read more: http://www.benzinga.com/pressreleases/15/07/p5708454/employers-use-of-multi-tier-pharmacy-benefits-continues-to-rise#ixzz3hI7z2tkt

Reference Pricing: “Net” Ingredient Cost for Top Selling Generic and Brand Prescription Drugs

Why is this document important?  Healthcare marketers are aggressively pursuing new revenue streams to augment lower reimbursements provided under PPACA. Prescription drugs, particularly specialty, are key drivers in the growth strategies of PBMs, TPAs and MCOs pursuant to healthcare reform. 

The costs shared below are what our pharmacy actually pays; not AWP, MAC or WAC. The bottom line; payers must have access to “reference pricing.” Apply this knowledge to hold PBMs accountable and lower plan expenditures for stakeholders.

How to Determine if Your Company [or Client] is Overpaying


Step #1:  Obtain a price list for generic prescription drugs from your broker, TPA, ASO or PBM every month.


Step #2:  In addition, request an electronic copy of all your prescription transactions (claims) for the billing cycle which coincides with the date of your price list.

Step #3:  Compare approximately 10 to 20 prescription claims against the price list to confirm contract agreement.  It’s impractical to verify all claims, but 10 is a sample size large enough to extract some good assumptions.

Step #4:  Now take it one step further. Check what your organization has paid, for prescription drugs, against our pharmacy cost then determine if a problem exists. When there is a 5% or more price differential (paid versus actual cost) we consider this a problem.

 
Multiple price differential discoveries means that your organization or client is likely overpaying. REPEAT these steps once per month.
 
Always include a semi-annual market check in your PBM contract language. Market checks provide each payer the ability, during the contract, to determine if better pricing is available in the marketplace compared to what the client is currently receiving.

When better pricing is discovered the contract language should stipulate the client be indemnified. Do not allow the PBM to limit the market check language to a similar size client, benefit design and/or drug utilization.  In this case, the market check language is effectually meaningless.

Emerging Trends in the Specialty Drug Market

Specialty drugs continue to make up a large portion of drug development and many specialty medications could soon see generic competition as the patents on 30 specialty products expire before 2020. These are a few of the emerging trends in the specialty drug market that were discussed during a session at the AMCP Specialty Pharmacy Conference.
 
The session, led by Aimee Tharaldson, PharmD, senior clinical consultant, emerging therapeutics, Express Scripts, highlighted key specialty pharmaceuti- cal trends, reviewed recently approved specialty medications, and looked ahead at new medications on the horizon. Drugs are considered specialty medications if they require frequent dosing adjustments or intensive clinical monitoring, if they require patient training, if they have a limited distribution, or if they require specialized handling. The prevalence of these type of drugs in the marketplace only continues to grow. According to data presented by Dr. Tharaldson, there was a greater number of FDA approvals in 2014 for specialty drugs than traditional medications, a trend that has consistently occurred since 2010.
 
While specialty medications are used to treat <1% of patients, they represent 32% of drug spend. “Due to the high cost of specialty medications, use of clinically appropriate management tools are necessary to ensure that patients have access to medications that improve health outcomes,” she said.
 
Within the specialty market, experts are seeing increased competition, more development of orphan drugs, and a number of drugs receiving designation as a breakthrough therapy. One indication of the increasing competition within the industry is the growing number of medications within therapy classes. For instance, in 2005, there were just 4 specialty medications for hepatitis C but that number has now grown to 13 in 2015. Just 10 years ago, no specialty drugs were approved to treat melanoma but now 6 drugs have reached the market.
 
Trends in the Specialty Market
 
A large number of patents on specialty and biologic products are also set to expire in the years ahead, creating new opportunity for generics. Dr. Tharaldson shared that 30 specialty products will face patent expirations before 2020, creating a $14.1 billion specialty generic opportunity. By the end of 2020, patents on 54 biologic products are set to expire creating an even larger $39.1 billion opportunity for biosimilars. The first biosimilar to hit the market received FDA approval earlier this spring and an additional 4 biosimilars are anticipated to earn approval this year.
 
“Initially, filgrastim-sndz and other early biosimilars are expected to act more like competing brands in the market,” Dr. Tharaldson said. It is expected, according to Dr. Tharaldson, that as interchangeability increases the poten- tial for cost savings with biosimilars will also increase. Another trend in the specialty market is the extensive number of orphan drugs in development; 41% of the drugs in the specialty pipeline are considered orphan drugs. Cancer drugs, the next highest category, make up 21% of the pipeline.
 
Since 2013, 15 drugs have been approved as breakthrough therapies. This designation is given to a drug or drug combination that treats a serious or life-threatening disease and has early evidence that it might provide a substantial improvement over existing therapies. In the current specialty market, the leading specialty drug therapy classes based on per member per year (PMPY) costs for 2014 are inflammatory conditions ($80/PMPY), multiple sclerosis ($52/ PMPY), and cancer ($42/PMPY). In 2014, specialty drug approvals were approved for indications ranging from ovarian cancer, to Gaucher disease and melanoma.
 
Proprotein convertase subtilisin/kexin type 9 (PCSK9) inhibitors, which are very effective in lowering low-density lipoprotein cholesterol, will enter the market this summer and could significantly impact pharmacy drug spend due to their potential to treat a large population of people. “PCSK9 inhibitors may cost $4000 to $12,000 per year,” said Dr. Tharaldson.
 
To continue reading click here.

Reference Pricing: “Net” Ingredient Cost for Top Selling Generic and Brand Prescription Drugs

Why is this document important?  Healthcare marketers are aggressively pursuing new revenue streams to augment lower reimbursements provided under PPACA. Prescription drugs, particularly specialty, are key drivers in the growth strategies of PBMs, TPAs and MCOs pursuant to healthcare reform. 

The costs shared below are what our pharmacy actually pays; not AWP, MAC or WAC. The bottom line; payers must have access to “reference pricing.” Apply this knowledge to hold PBMs accountable and lower plan expenditures for stakeholders.

How to Determine if Your Company [or Client] is Overpaying

Step #1:  Obtain a price list for generic prescription drugs from your broker, TPA, ASO or PBM every month.


Step #2:  In addition, request an electronic copy of all your prescription transactions (claims) for the billing cycle which coincides with the date of your price list.

Step #3:  Compare approximately 10 to 20 prescription claims against the price list to confirm contract agreement.  It’s impractical to verify all claims, but 10 is a sample size large enough to extract some good assumptions.

Step #4:  Now take it one step further. Check what your organization has paid, for prescription drugs, against our pharmacy cost then determine if a problem exists. When there is a 5% or more price differential (paid versus actual cost) we consider this a problem.

 
Multiple price differential discoveries means that your organization or client is likely overpaying. REPEAT these steps once per month.
 
— Tip —
 
Always include a semi-annual market check in your PBM contract language. Market checks provide each payer the ability, during the contract, to determine if better pricing is available in the marketplace compared to what the client is currently receiving.

When better pricing is discovered the contract language should stipulate the client be indemnified. Do not allow the PBM to limit the market check language to a similar size client, benefit design and/or drug utilization.  In this case, the market check language is effectually meaningless.

Will Specialty Oncology Products Follow the Sovaldi Way?

Bruce Feinberg, DO, vice president and chief medical officer of Cardinal Health Specialty Solutions, moderated the panel that consisted of Scott Gottlieb, MD, resident fellow at the American Enterprise Institute; Brian Kiss, MD, vice president of healthcare transformation at Blue Cross Blue Shield of Florida; Michael Kolodziej, MD, national medical director for oncology strategy at Aetna; and Ted Okon, MBA, executive director of Community Oncology Alliance (COA).

While precision medicine has tremendous potential and expands patient options, the growth in the field of oral therapeutics will significantly affect payers, said Feinberg, because of the arbitrary separation that exists between pharmacy benefit and medical benefit. Feinberg explained that oral therapeutics will have a huge impact on physician clinics where chemotherapeutic infusions were traditionally administered, because not all clinics have the ability to dispense these medications through an onsite pharmacy, and in many cases state laws prohibit it. He also questioned whether oral treatments will be effective in maintaining patient-centeredness.

Patients often mistake oral therapy for a cheaper alternative to chemotherapy, said Okon. He agreed with Feinberg that with oral medications accounting for 25% to 35% of the oncology pipeline, we have a new situation to which everyone must adapt. Okon went on to explain the real-world problems with oral therapeutics, especially concerning treatment adherence.  


While the provider retains control with infusion treatments, with oral drugs, the onus lies with the patient. “We’ve done a lot of research at COA on this, and basically, it’s actually tied to cost,” he said. According to Okon, studies have shown that irrespective of cost, 10% of patients don’t fill even the first prescription, which complicates clinical and payer decisions if the treatment fails. 

Feinberg turned to the payers in the room, asking each to explain the strategy for medication therapy management, adherence, compliance, and persistence, and how these expensive medications impact the overall payer budget.

The Payer Strategy

Kiss said that payers have found a way out: negotiating price deals with vendors. But these channels may not be accessible to a clinical oncologist, he said. “So you have a drug that’s $1000, which may be the patient’s out-of-pocket cost. They take the prescription to their Walgreens. And you know Walgreens can get the drug in 48 hours and still do it, but [now] instead of being $1000, it may be $1400.” These variables have resulted in an increasing shift of cost burden to the patient, according to Kiss. 

Another complication is that patients have the option of receiving these oral oncology drugs by mail order; if they cannot tolerate the side effects of the drug, they might stop taking them in a few days, “Which can result in huge wastage because now they have the rest of the month’s supply in their medicine cabinet.” Both Feinberg and Kiss noted that this problem is not confined to oncology; already, we are seeing a spillover into rheumatology and other therapeutic areas where novel oral therapeutics are being developed. 

See more at: http://www.ajmc.com/journals/evidence-based-oncology/2015/The-American-Society-of-Clinical-Oncology-Annual-Meeting-2015/Will-Specialty-Oncology-Products-Follow-the-Sovaldi-Way#sthash.jGnchLVI.dpuf

Reference Pricing: “Net” Ingredient Cost for Top Selling Generic and Brand Prescription Drugs

Why is this document important?  Healthcare marketers are aggressively pursuing new revenue streams to augment lower reimbursements provided under PPACA. Prescription drugs, particularly specialty, are key drivers in the growth strategies of PBMs, TPAs and MCOs pursuant to healthcare reform. 

The costs shared below are what our pharmacy actually pays; not AWP, MAC or WAC. The bottom line; payers must have access to “reference pricing.” Apply this knowledge to hold PBMs accountable and lower plan expenditures for stakeholders.

How to Determine if Your Company [or Client] is Overpaying

Step #1:  Obtain a price list for generic prescription drugs from your broker, TPA, ASO or PBM every month.


Step #2:  In addition, request an electronic copy of all your prescription transactions (claims) for the billing cycle which coincides with the date of your price list.

Step #3:  Compare approximately 10 to 20 prescription claims against the price list to confirm contract agreement.  It’s impractical to verify all claims, but 10 is a sample size large enough to extract some good assumptions.

Step #4:  Now take it one step further. Check what your organization has paid, for prescription drugs, against our pharmacy cost then determine if a problem exists. When there is a 5% or more price differential (paid versus actual cost) we consider this a problem.

 
Multiple price differential discoveries means that your organization or client is likely overpaying. REPEAT these steps once per month.
 
— Tip —
 
Always include a semi-annual market check in your PBM contract language. Market checks provide each payer the ability, during the contract, to determine if better pricing is available in the marketplace compared to what the client is currently receiving. 

When better pricing is discovered the contract language should stipulate the client be indemnified. Do not allow the PBM to limit the market check language to a similar size client, benefit design and/or drug utilization.  In this case, the market check language is effectually meaningless.


Controlling Pharmacy Costs

Two themes have driven what I’ve covered in this column this year: how to treat employees with dignity through the benefits we offer, and how to create beautiful, elegant benefits solutions that work.

Under these guidelines, I believe I’ve found a company that accomplishes both: GoodRx—a web and app-based service providing consumers with the lowest prices available on prescription drugs. (Note: I have no financial relationship with this company or its leadership.)

When GoodRx first came on my radar in 2012, the company’s co-founder, Doug Hirsch, described their mission this way: “We want to mimic companies like Orbitz and create prescription-drug-price transparency so consumers are informed and can afford the medications they need.” 

I reconnected with Hirsch in early 2015 after having a personal GoodRx experience. I was picking up the one prescription drug I take and was surprised to find at the register that my health plan no longer covered the medication. My pharmacist told me I was responsible for the $100 charge. After pausing for a moment, I remembered I had the GoodRx app on my smartphone. To my delight, I discovered my pharmacy offered the lowest price available with the GoodRx discount. I saved $40 on the spot.

I contacted Hirsch to thank him for the savings, and discovered in the ensuing conversation that the company had grown its services to include a transparent pharmacy benefit management program for employers, as well as a GoodRx platform for physicians, and even a GoodRx search for pet pharmaceuticals.

After further research on GoodRx and the PBM world in general, I wanted to share key points with HR leaders.

PBMs first came into being during the mid-1980s. They largely acted as a third-party administrator for pharmacy claims and held a fiduciary responsibility to clients to find the best prices for prescription drugs. PBMs managed two contracts to produce its services: one with the pharmacy networks it created, and the other with the plan sponsors (a self-insured employer or a health plan).

The mail-order pharmacy business began in the early 1990s. In this scenario, PBMs were no longer negotiating with pharmacy networks; they were negotiating with themselves.  

Dispensing through their own mail-order pharmacy allows PBMs to ensure patient adherence to treatment and formulary compliance, using in-house pharmacists to contact physicians to switch patients to preferred brand drugs or get prescriptions renewed. Greater ability to shift share can bring larger rebates on brands.

When you talk with PBM experts, most will highlight the cost of PBM services as a combination of administrative fees, manufacturer revenue and spread. The primary caution they will share with employers, however, is the need to understand “spread.”

According to a paper written for the Department of Labor’s 2014 ERISA Advisory Council, here is an example of how spread works:

“The PBM may reimburse pharmacies for drugs at the [Average Wholesale Price] minus 18 percent plus a dispensing fee. These payment rates at which PBMs reimburse pharmacies are not generally known to plan sponsors. The PBM contracts for reimbursement from the sponsor at a somewhat smaller discount off AWP, say AWP minus 16 percent plus a $2 administration fee per script. The difference between the sponsor’s payment rate to the PBM and the PBM’s payment rate to the pharmacy is known as the ‘retail spread’ and is a significant source of PBM’s net revenue.”

To read more click here.

Reference Pricing: “Net” Ingredient Cost for Top Selling Generic and Brand Prescription Drugs

Why is this document important?  Healthcare marketers are aggressively pursuing new revenue streams to augment lower reimbursements provided under PPACA. Prescription drugs, particularly specialty, are key drivers in the growth strategies of PBMs, TPAs and MCOs pursuant to healthcare reform. 

The costs shared below are what our pharmacy actually pays; not AWP, MAC or WAC. The bottom line; payers must have access to “reference pricing.” Apply this knowledge to hold PBMs accountable and lower plan expenditures for stakeholders.

How to Determine if Your Company [or Client] is Overpaying

Step #1:  Obtain a price list for generic prescription drugs from your broker, TPA, ASO or PBM every month.


Step #2:  In addition, request an electronic copy of all your prescription transactions (claims) for the billing cycle which coincides with the date of your price list.

Step #3:  Compare approximately 10 to 20 prescription claims against the price list to confirm contract agreement.  It’s impractical to verify all claims, but 10 is a sample size large enough to extract some good assumptions.

Step #4:  Now take it one step further. Check what your organization has paid, for prescription drugs, against our pharmacy cost then determine if a problem exists. When there is a 5% or more price differential (paid versus actual cost) we consider this a problem.

 
Multiple price differential discoveries means that your organization or client is likely overpaying. REPEAT these steps once per month.
 
— Tip —
 
Always include a semi-annual market check in your PBM contract language. Market checks provide each payer the ability, during the contract, to determine if better pricing is available in the marketplace compared to what the client is currently receiving. 

When better pricing is discovered the contract language should stipulate the client be indemnified. Do not allow the PBM to limit the market check language to a similar size client, benefit design and/or drug utilization.  In this case, the market check language is effectually meaningless.