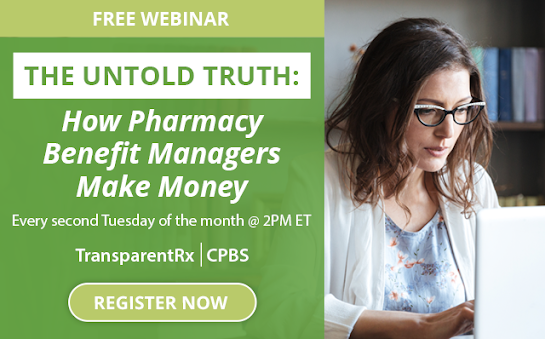
The Untold Truth: How Pharmacy Benefit Managers Make Money [Free Webinar]

How many businesses do you know want to cut their revenues in half? That’s why traditional pharmacy benefit managers don’t offer a fiduciary standard and instead opt for hidden cash flow opportunities such as rebate masking. Want to learn more?

Here is what some participants have said about the webinar.

Thank you Tyrone. Nice job, good information.” David Stoots, AVP

“Thank you! Awesome presentation.” Mallory Nelson, PharmD

“Thank you Tyrone for this informative meeting.” David Wachtel, VP

“…Great presentation! I had our two partners on the presentation as well. Very informative.” Nolan Waterfall, Agent/Benefits Specialist


A snapshot of what you will learn during this 30 minute webinar:

  • Hidden cash flows in the PBM Industry
  • Basic to intermediate level PBM terminologies
  • Specialty pharmacy cost-containment strategies
  • Examples of drugs that you might be covering that are costing you
  • The #1 metric to measure when evaluating PBM proposals

Sincerely,
TransparentRx
Tyrone D. Squires, MBA  
10845 Griffith Peak Drive, Suite 200  
Las Vegas, NV 89135 
Office: (866) 499-1940
Mobile: (702) 803-4154


P.S.  Yes, it’s recorded. I know you’re busy … so register now and we’ll send you the link to the session recording as soon as it’s ready.  

Reference Pricing: “Gross” Invoice Cost vs. AWP for Popular Generic and Brand Prescription Drugs (Volume 374)

This document is updated weekly, but why is it important? Healthcare marketers are aggressively pursuing new revenue streams to augment lower reimbursements provided under PPACA. Prescription drugs, particularly specialty, are key drivers in the growth strategies of PBMs, TPAs, and MCOs pursuant to health care reform.

How to Determine if Your Company [or Client] is Overpaying

Step #1:  Obtain a price list for generic prescription drugs from your broker, TPA, ASO or PBM every month.

Step #2:  In addition, request an electronic copy of all your prescription transactions (claims) for the billing cycle which coincides with the date of your price list.

Step #3:  Compare approximately 10 to 20 prescription claims against the price list to confirm contract agreement. It’s impractical to verify all claims, but 10 is a sample size large enough to extract some good assumptions.

Step #4:  Now take it one step further. Check what your organization has paid, for prescription drugs, against our acquisition costs then determine if a problem exists. When there is more than a 5% price differential for brand drugs or 25% (paid versus actual cost) for generic drugs we consider this a potential problem thus further investigation is warranted.

Multiple price differential discoveries mean that your organization or client is likely overpaying. REPEAT these steps once per month.

— Tip —

Always include a semi-annual market check in your PBM contract language. Market checks provide each payer the ability, during the contract, to determine if better pricing is available in the marketplace compared to what the client is currently receiving.

Tip of the Week: Non-Fiduciary PBMs Hedge Against Their Legacy Business Models

Anthem and Humana have invested nearly $140 million to form a new pharmacy benefit manager, as criticism over traditional PBMs’ operations kickstarts business at startups that promise transparency. The new venture comes as more payers begin to question the work of the “Big Three” PBMs.

  • In 2019, Anthem launched in-house PBM IngenioRx, after suing Cigna’s Express Scripts for $15 billion over allegations the company withheld savings and overcharged the insurer.
  • In April, Costco announced it was expanding its partnership with Madison, Wisc.-based Navitus Health Solutions, a PBM owned by SSM Health
  • Ohio announced it was partnering with Tysons, Va.-based Gainwell Technologies to operate its own PBM, which it expects to save the state $240 million in drug costs each year, compared with its former private operators.

Tyrone’s Commentary:

Every profession and industry has its bad actors, and ours is no different. Just because the business model of non-fiduciary PBMs has become layer upon layer of self-dealing, it is important to remember that many of our peers are doing good work within the walls of those enterprises as well. In our ongoing effort to push the industry toward radical transparency, we will continue with education as our focal point because we know there are fantastic people within the industry who can help us in our goal to raise the standard of care for purchasers of PBM services. Afterall, education is the key to getting to lowest net cost.

The insurers, Anthem and Cigna, will hold a minority stake in the new joint venture, named DomaniRx, which is being championed by SS&C Technologies. The Windsor, Conn.-based fintech company owns approximately 80% of the new business, according to a filing submitted to the U.S. Securities and Exchange Commission on July 15. 

Humana will serve as DomaniRx’s first customer. The Louisville, Ky.-based insurer currently operates its own PBM. Humana and Anthem hold a non-exclusive license to RxNova SS&C’s existing claims processing platform.

Continue Reading >>

Reference Pricing: “Gross” Invoice Cost vs. AWP for Popular Generic and Brand Prescription Drugs (Volume 374)

This document is updated weekly, but why is it important? Healthcare marketers are aggressively pursuing new revenue streams to augment lower reimbursements provided under PPACA. Prescription drugs, particularly specialty, are key drivers in the growth strategies of PBMs, TPAs, and MCOs pursuant to health care reform.

How to Determine if Your Company [or Client] is Overpaying

Step #1:  Obtain a price list for generic prescription drugs from your broker, TPA, ASO or PBM every month.

Step #2:  In addition, request an electronic copy of all your prescription transactions (claims) for the billing cycle which coincides with the date of your price list.

Step #3:  Compare approximately 10 to 20 prescription claims against the price list to confirm contract agreement. It’s impractical to verify all claims, but 10 is a sample size large enough to extract some good assumptions.

Step #4:  Now take it one step further. Check what your organization has paid, for prescription drugs, against our acquisition costs then determine if a problem exists. When there is more than a 5% price differential for brand drugs or 25% (paid versus actual cost) for generic drugs we consider this a potential problem thus further investigation is warranted.

Multiple price differential discoveries mean that your organization or client is likely overpaying. REPEAT these steps once per month.

— Tip —

Always include a semi-annual market check in your PBM contract language. Market checks provide each payer the ability, during the contract, to determine if better pricing is available in the marketplace compared to what the client is currently receiving.

Tip of the Week: The Specialty Drug Pipeline Will Make You Rethink Your Pharmacy Benefits Management Strategy

Employers should be aware that the new drug pipeline focuses on manufacturer investments in developing high-cost brand, specialty and orphan drugs. With more than 8,000 drugs in development, new drug launches will reach historically high levels over the next several years.

New and potentially lifesaving or life-prolonging therapies are reviewed and approved every year, but generally there are two drug pipelines to monitor: novel drugs coming to the market for the first time for any indication, and new indications for existing medications already approved by the U.S. Food and Drug Administration (FDA).
There are several recommended strategies that are proven effective for managing high-cost specialty drugs today. It begins with first understanding the financial and member disruption (i.e., employee retention/recruitment impact) goals for each employer. Then you can focus on these four key areas to ensure a holistic solution is in place to manage costs and appropriate utilization in line with both the contract and clinical perspectives:


1. Maximize contract value:
Obtain the lowest net costs with radically transparent discounts and manufacturer revenue yield through an aligned formulary coupled with an unbiased analysis and independent review strategy. Easier said than done.

2. Evaluate plan design: Examine tiering, copay vs. coinsurance, HDHP vs non-HDHP; Deductibles/Out of Pocket Maximum changes, separate medical/pharmacy accumulators, network design, mail order, Dispense as Written penalties, etc., as well as the extent of each change under consideration (ex: 10% vs 20% coinsurance).
3. Eliminate wasteful spending: Remove questionable low clinical value medications from the formulary; independently review prior authorizations, suspect high-dollar claims, and drugs with the potential to be used off-label; optimize existing therapy and dosing to remedy any per-dose cost improvement opportunities; and independently verify appropriate indication and dosing for complex conditions.
4. Manufacturer assistance programs: Leverage available manufacturer-provided member incentives on specialty medications through a PBM systems-based approach, as opposed to partial carveout solutions that require manual formulary and system manipulations that generate additional risks and inefficiencies.

Tyrone’s Commentary:
Pharmaceutical manufacturers are light years ahead of plan sponsors including both public and private entities. They are keenly aware that the “free” drugs given away today are a temporary slow down of specialty drug spend, for instance. They will continue to innovate and manufacture curative pharmaceutical products. As a result, more and more people will not qualify for patient assistance and/or exhaust coupon savings programs. Many plans will see their drug spend fall back to pre-manufacturer assistance levels in 2-3 years. Specialty drugs will soon account for more than three-quarters (75%) of total drug spend wiping away early gains from manufacturer cost-saving programs. 

Continue Reading >>

Costco approach could have saved Medicare $2.6 billion in drug spending, analysis shows

Medicare spent billions more money on generic drugs for its beneficiaries than warehouse chain Costco did for the same drugs, according to an analysis published Tuesday. This overspending hit $2.6 billion in 2018, Erin Trish, associate director of the University of Southern California’s Schaeffer Center for Health Policy and Economics, and colleagues wrote in a letter to the Journal of the American Medical Association’s JAMA internal Medicine.

Figure 1: Five P’s of Decision-Making

Tyrone’s Commentary:

Purchasers of PBM services need to recognize that smaller PBMs can provide similar or better levels of service at a lower cost. Your jobs are not at risk for trying a different approach when the current strategy is severely flawed. In fact, just the opposite is true. Save your company a few million bucks and you have grounds for a pay raise and/or promotion. What drives decisions in your PBM selection process? The best leaders, with P&L responsibility, make decisions at the top of the pyramid (see figure 1). Assess yourself as a plan sponsor. 

They compared the amount Medicare pays for common generic prescriptions in its Part D prescription coverage with prices available to patients without insurance at Costco for 184 common generic drug products. “Medicare overspent by 13.2% in 2017 and 20.6% in 2018 compared with Costco member prices for these prescriptions,” they wrote. “Total overspending increased from $1.7 billion in 2017 to $2.6 billion in 2018.”

Continue Reading>>

Reference Pricing: “Gross” Invoice Cost vs. AWP for Popular Generic and Brand Prescription Drugs (Volume 373)

This document is updated weekly, but why is it important? Healthcare marketers are aggressively pursuing new revenue streams to augment lower reimbursements provided under PPACA. Prescription drugs, particularly specialty, are key drivers in the growth strategies of PBMs, TPAs, and MCOs pursuant to health care reform.

How to Determine if Your Company [or Client] is Overpaying

Step #1:  Obtain a price list for generic prescription drugs from your broker, TPA, ASO or PBM every month.

Step #2:  In addition, request an electronic copy of all your prescription transactions (claims) for the billing cycle which coincides with the date of your price list.

Step #3:  Compare approximately 10 to 20 prescription claims against the price list to confirm contract agreement. It’s impractical to verify all claims, but 10 is a sample size large enough to extract some good assumptions.

Step #4:  Now take it one step further. Check what your organization has paid, for prescription drugs, against our acquisition costs then determine if a problem exists. When there is more than a 5% price differential for brand drugs or 25% (paid versus actual cost) for generic drugs we consider this a potential problem thus further investigation is warranted.

Multiple price differential discoveries mean that your organization or client is likely overpaying. REPEAT these steps once per month.

— Tip —

Always include a semi-annual market check in your PBM contract language. Market checks provide each payer the ability, during the contract, to determine if better pricing is available in the marketplace compared to what the client is currently receiving.

Tip of the Week: Fiduciary Model Pharmacy Benefit Managers (PBM) are a Thing

Clayton Christensen’s business concept of “The Innovator’s Dilemma” is one of my favorite books. In it he writes about how incumbent companies lose to new business models because they are too busy protecting their older legacy business models. Non-fiduciary PBMs don’t focus on a fiduciary standard of care or radical transparency because they are too busy protecting their older, opaque business models. 


Disruptive innovations tend to be produced by outsiders and entrepreneurs in startups, rather than existing market-leading companies. The business environment of market leaders does not allow them to pursue disruptive innovations when they first arise, because they are not profitable enough at first and because their development can take scarce resources away from sustaining innovations (which are needed to compete against current competition). Small teams are more likely to create disruptive innovations than large teams. A disruptive process can take longer to develop than by the conventional approach and the risk associated to it is higher than the other more incremental or evolutionary forms of innovations, but once it is deployed in the market, it achieves a much faster penetration and higher degree of impact on the established markets.

TransparentRx is the first fiduciary model PBM in America and now another PBM, Drexi, has joined the ranks of the disruptive. From the press release, “Advanced Medical Pricing Solutions (AMPS), a pioneer in healthcare cost containment, is pleased to announce the expansion of its fiduciary duties to include Drexi, its pharmacy benefits manager (PBM) solution…The expansion makes it one of the first PBM fiduciaries in the U.S.” I like how they were careful to write “one of the first.”

We welcome the competition as it benefits the market – plan sponsors, patients and other stakeholders. It also makes our job easier when explaining the difference between a fiduciary PBM and one that isn’t to a potential client. I’ve not yet personally had a chance to review the AMP’s PBM service agreement so I can’t comment on whether or not the contract nomenclature is truly fiduciary in law and spirit. Here are some things employers must look out for when considering doing business with a fiduciary PBM.

1) PBM or Pharmacy Benefit Administrator (PBA) provides radical transparency

2) Any revenue currently collected by the PBM from the manufacturer or rebate aggregator is disclosed and employers receive 100% of these earned refunds (less data fees) 

3) Gives full auditing rights in PBM contracts including unrestrictive access to claims data

4) Fiduciary PBMs are substantially at risk. $100K on a $10M drug spend is not substantial

5) No exclusivity. The primary reason PBMs suggest you not carve-out is due to their own selfishness. Despite what they tell you it is not because carve-in adds more value. They only share the good it does not the harm. Caterpillar has carved-out PBM services for more than a decade with much success.

6) Elimination of spreads. In some cases, a PBM will charge the plan sponsor more than they pay the pharmacy to fill a prescription.

In business theory, a disruptive innovation is an innovation that creates a new market and value network and eventually displaces established market-leading firms, products, and alliances. I’d be worried if my wagon were hitched to a PBM holding on to old legacy business models.

Reference Pricing: “Gross” Invoice Cost vs. AWP for Popular Generic and Brand Prescription Drugs (Volume 373)

This document is updated weekly, but why is it important? Healthcare marketers are aggressively pursuing new revenue streams to augment lower reimbursements provided under PPACA. Prescription drugs, particularly specialty, are key drivers in the growth strategies of PBMs, TPAs, and MCOs pursuant to health care reform.

How to Determine if Your Company [or Client] is Overpaying

Step #1:  Obtain a price list for generic prescription drugs from your broker, TPA, ASO or PBM every month.

Step #2:  In addition, request an electronic copy of all your prescription transactions (claims) for the billing cycle which coincides with the date of your price list.

Step #3:  Compare approximately 10 to 20 prescription claims against the price list to confirm contract agreement. It’s impractical to verify all claims, but 10 is a sample size large enough to extract some good assumptions.

Step #4:  Now take it one step further. Check what your organization has paid, for prescription drugs, against our acquisition costs then determine if a problem exists. When there is more than a 5% price differential for brand drugs or 25% (paid versus actual cost) for generic drugs we consider this a potential problem thus further investigation is warranted.

Multiple price differential discoveries mean that your organization or client is likely overpaying. REPEAT these steps once per month.

— Tip —

Always include a semi-annual market check in your PBM contract language. Market checks provide each payer the ability, during the contract, to determine if better pricing is available in the marketplace compared to what the client is currently receiving.

Tip of the Week: Pharmaceutical Manufacturers are Light Years Ahead of Commercial and Public Sector Employers, Unions, Health Plans and Health Systems

Specialty Pharmacies are most often focused on the dispensation of specialty drugs.  While there is no standardized definition of what constitutes a specialty drug, most often the meet the following criteria:
  • the drug is a specialized, high cost product (typically more than $500 per dose or $10000 or more per year)
  • the drug is utilized as a complex therapy for a complex disease
  • the drug requires special handling or administering, shipping, or storage (such as an injectable)
  • the drug may have a Food and Drug Administration (FDA) Risk Evaluation and Mitigation Strategy (REMS) in place specifying that there is required training, certifications, or other requirements that must be met in order for the drug to be administered.
  • the drug has the potential for significant waste due to high cost
Specialty drugs are used to treat a variety of complex and chronic conditions including but not limited to: anemia, cancer, infertility, multiple sclerosis, HIV and hepatitis.  Some categorize specialty drugs as meeting all of the three H’s: High Cost, High Complexity, High Touch.
Click to Learn More

Because of the specialized way in which these drugs need to be administered, specialty pharmacies come into play with a specific focus on this group of drugs and the required comprehensive and coordinated delivery and support required to effectively deliver these drugs to patients. 

Tyrone’s Commentary:
Pharmaceutical manufacturers are light years ahead of plan sponsors including both public and private entities. They are keenly aware that the “free” drugs given away today are a temporary slow down of specialty drug spend, for instance. They will continue to innovate and manufacture curative pharmaceutical products. As a result, more and more people will not qualify for patient assistance and/or exhaust coupon savings programs. Many plans will see their drug spend fall back to pre-manufacturer assistance levels in 2-3 years. Specialty drugs will soon account for more than three-quarters (75%) of total drug spend wiping away early gains from manufacturer cost-saving programs. Like drugmakers, employers should be planning 4-5 years ahead not waiting until the time comes for renewal. Radical transparency in pharmacy network and manufacturer contracting, efficient benefit design including lowest net cost formularies, and medication adherence programs are hallmarks of good pharmacy benefit management stewardship. Those pharmacy benefit management principles should never take a back seat.

AMS, a healthcare IT company that provides clinical insights and financial analysis of the costliest and most complex medical claims, released their 2020 Specialty Drug Trends Report today, highlighting the need for predictive analytics to combat pervasive drug overspend.

AMS research reveals that payers are not being judicious with their specialty drug expenditures because they have little insight into the actual drivers of high-cost claims and members. Those drivers include cost increases, price transparency issues, and perhaps the fastest-growing area of pharmacy spend, utilization expansion. Detailed cost-driver reporting is needed for payers to alleviate high-cost claim overpayments and predict future liabilities.

Highlights of the report: 

  • Fewer than 2% of the U.S. population utilized specialty drugs
  • Specialty drugs account for more than half (51%) of total drug spend
  • 80% of annual medical trend increases were driven by specialty drug costs
  • The top 10 Medicare Part B covered drugs accounted for 2% of all covered products but 43% of total Part B drug spending


<<Click to Download the Full Report>>