Reference Pricing: “Gross” Invoice Cost for Popular Generic and Brand Prescription Drugs (Volume 200)

This document is updated weekly, but why is it important?  Healthcare marketers are aggressively pursuing new revenue streams to augment lower reimbursements provided under PPACA. Prescription drugs, particularly specialty, are key drivers in the growth strategies of PBMs, TPAs and MCOs pursuant to health care reform.

The costs shared here are what the pharmacy actually pays; not AWP, MAC or WAC. The bottom line; payers must have access to actual acquisition costs or AAC. Apply this knowledge to hold PBMs accountable and lower plan expenditures for stakeholders.


How to Determine if Your Company [or Client] is Overpaying

Step #1:  Obtain a price list for generic prescription drugs from your broker, TPA, ASO or PBM every month.

Step #2:  In addition, request an electronic copy of all your prescription transactions (claims) for the billing cycle which coincides with the date of your price list.

Step #3:  Compare approximately 10 to 20 prescription claims against the price list to confirm contract agreement.  It’s impractical to verify all claims, but 10 is a sample size large enough to extract some good assumptions.

Step #4:  Now take it one step further. Check what your organization has paid, for prescription drugs, against our acquisition costs then determine if a problem exists. When there is a 5% or more price differential (paid versus actual cost) we consider this a problem.

Multiple price differential discoveries means that your organization or client is likely overpaying. REPEAT these steps once per month.

— Tip —


Always include a semi-annual market check in your PBM contract language. Market checks provide each payer the ability, during the contract, to determine if better pricing is available in the marketplace compared to what the client is currently receiving.


When better pricing is discovered the contract language should stipulate the client be indemnified. Do not allow the PBM to limit the market check language to a similar size client, benefit design and/or drug utilization. In this case, the market check language is effectually meaningless.

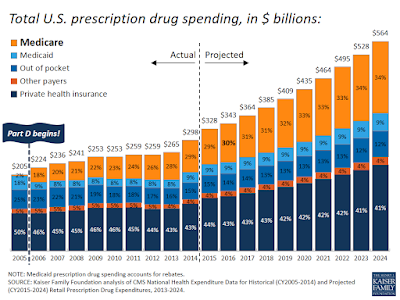
Drug prices rise as big pharma profit soars

The amount of money people spend on prescription drugs has nearly doubled over the past three decades as pharmaceutical sales and profit margins have ballooned, according to a government report.

Retail prescription drug expenses accounted for about 12% of total U.S. healthcare spending in 2015, up from about 7% through the 1990s. Pharmaceutical and biotechnology sales revenue increased from $534 billion to $775 billion between 2006 and 2015, according to a recent report from the U.S. Government Accountability Office. About two-thirds of drug companies saw their profit margins increase over that period, averaging 17.1%.

The GAO, along with other policy experts and government institutions, set out to identify the drivers behind one of the fastest-growing expenses in healthcare. Rising drug prices have caused hospitals and consumers to put off treatment or find workarounds that aren’t as effective. Surging pharmaceutical costs coupled with looming policy uncertainty have caused providers to cut back on hospital expenditures that would improve operations.

The GAO found that much of the rise in drug spending, which is expected to increase by nearly 8% in 2018, was fueled by the use of expensive brand-name drugs, although some pharmaceutical companies have increased generic drug prices as well. Also, limited competition has inflated drug prices while consolidation among some of the largest pharmaceutical companies has stifled research and development spending and new patents issued, research shows.

[Read More]

More transparency on generic drug acquisition cost data could save $4 billion

Increasing transparency on the cost of generic drugs could save about $4 billion a year in overall healthcare spending in the U.S., according to a new paper. Making actual generic drug acquisition costs available to third-party payers would empower health plans to negotiate lower rates and essentially level the playing field in a pharmaceutical supply chain that’s shrouded in secrecy.

Tyrone’s commentary:

If acquisition cost data were to be made available for generic drugs, the work is just beginning for third-party payers such as self-funded employers. First, the plan sponsor and their advisors must properly interpret the data. Interpretation of pharmacy data requires the purchaser to understand not only what they want to achieve in their relationship with their PBM but also the competitive market and their ability to drive disclosure of details on services important to them. This level of understanding requires an indeterminate amount of time and energy. Are you up for it? If so, keep reading. 

Don’t rely solely on analytical software to do the job for you. USA Track & Field, which approves official events, has a 66-page manual of procedures just for certifying marathon races! It lists 13 items of necessary equipment for measuring a race including masking tape and spray paint for temporary markers, a pocket calculator with at least 8 digits, a good road bicycle preferably with high pressure tires and a Jones counter, a device which attaches to the front bike wheel and measures distance by counting revolutions.

The point is that a strong human element is required for success in assessing transparency which is done more effectively by a trained eye with personal knowledge of the purchaser’s benefit and disclosure goals. Lest I forget, don’t take for granted that the PBMs definition of a generic drug is in alignment with your plan design goals. See the snapshot below, taken from TransparentRx’s fiduciary contract, of a strong definiton for those products considered to be generic drugs.

Click to Learn More

Ultimately, patients would pay less at the expense of pharmacy benefit mangers’ profits, researchers said. If the average prescription generic drug priced at $26 was reduced by $1, that would reduce health spending by $4 billion every year, data shows. The average price for branded drugs is $308.

The actual amounts paid to drug manufacturers for both branded and generic prescriptions, including reductions negotiated by PBMs, are protected as confidential trade secrets, according to analysis from the Leonard D. Schaeffer Initiative for Innovation in Health Policy, which is a partnership between the Center for Health Policy at Brookings and the USC Schaeffer Center for Health Policy & Economics.

[Read More]