Friction Between Health Plans, Pharma Grows Over Specialty Drugs

The war of words between managed care and pharmaceutical manufacturers, which began when Gilead set the price for its drug to treat the hepatitis C virus (HCV), has taken off in October with the reclassification of a trio of cancer drugs from Genentech.

Growth in the “specialty pharma” sector, where prices are rising much faster than drug prices generally, has drawn concern from payers and the umbrella group that represents them, while the trade group that represents drugmakers is pushing back against critics, saying that it faces challenges in bringing life-saving therapies to market.

All this is playing out against the backdrop of the Affordable Care Act (ACA), which professes to rein in the nation’s escalating healthcare costs, including drug prices. As the second year of open enrollment on the exchanges gets underway, a series of events in the healthcare sector have spilled into the public arena, just in time for the November 4 midterm elections:

  • America’s Health Insurance Plans (AHIP) took aim at the $1000-per-pill cost of Gilead’s Sovaldi, the breakthrough treatment for HCV as a symbol of the rising challenge of the specialty pharma sector, which AHIP says accounts for an “unsustainable” share of health plans. An AHIP issue brief from February 2014 stated that in 2012, specialty drugs accounted for 1% of all prescriptions but 25% of the drug costs.
  • On September 18, 2014, Genentech announced that 3 mainstay cancer therapies – Avastin, Herceptin, and Rituxan – would no longer be available to hospitals from wholesale distributors and would instead be sold through a select group of specialty distributors, increasing their costs. The change took effect October 1, 2014, giving the hospitals little time to absorb the change.
  • On October 5, 2014, leading oncologists took aim at pharmaceutical prices in a 60 Minutes segment in which one clinician said that, “High cancer drug prices are harming patients, because either you come up with the money, or you die.”

In recent days, the Pharmaceutical Research and Manufacturers of America, or PhRMA, has countered with its Access Better Coverage initiative, which is designed to guide consumers shopping for coverage on the exchanges as they select health plans based on what out-of-pocket expenses they would face for prescription drugs.

But the broader message of the campaign is to point out instances in which plans have assigned all patients with conditions such as HIV into higher-price drug tiers, which was the topic of a well-read editorial in The American Journal of Managed Care by Gerry Oster, PhD, and A. Mark Fendrick, MD.

by Mary K. Caffrey

Pharmacy Carve-Out: 7 Benefits for Self-Funded or Fully Insured Employers

PBM programs typically function in two ways. They are either “carved in”, provided by the health insurance company or “carved out”, provided independent of insurance. Whether the pharmacy benefit plan is self-funded or fully insured, any employer with more than 100 active employees should consider and investigate a carve-out strategy for their pharmacy benefits.

A carved out program provides better cost control and transparency, technology and services, as well as information and reporting. Health insurers may bundle the two programs and subsidize some of the pricing from one service with that of another.

For companies with a carved in program, there may be concerns about changing to a carved out program due to a perception that additional time and resources will be needed, but I have seen that on a day to day basis, there is little difference in having a separate PBM program. The functions are the same.

Over the course of a year, there are separate review meetings for companies with carved out programs, but overall, the time spent should be roughly the same as meetings taking place with carved in providers.

From the employees point of view there is virtually no change besides possibly another card in their wallet. They will have continued access to the full range of services offered by a PBM. In fact, many carved in programs use third party PBM companies to provide the pharmacy services.

Believe it or not, as companies get through the open enrollment season for benefits, the planning cycle starts for the next year – in this case 2016. The first quarter of the year is the time for benefits teams to review contracts and benefits plans, including pharmacy benefit plans.

What are the Benefits of a Pharmacy Carve-out?

There are significant advantages to pursuing a carve-out strategy, both for the plan sponsor and plan participants. Among the advantages are the following:

1.  Better Contract Terms – Carved-in plans are based on a single, pre-determined contract that does not allow a plan sponsor or its advisor to negotiate non-pricing terms critical to managing cost trends. For example, carved-in Rx plans seldom have audit rights and, if they do, they are frequently toothless. Detailed clinical programs are also usually missing. Conversely, a carved-out PBM contract, if correctly negotiated by the plan sponsor or an advisor specializing in pharmacy benefit contracting, will clearly outline all of the important non-pricing terms.

2.  Carved-out Specialty Rx – A carved-out PBM also permits the plan sponsor to install a carved-out specialty pharmacy benefit. Because specialty pharmacy is the fastest growing and most expensive portion of any pharmacy benefit plan, carving-out specialty drugs provides all of the advantages listed above.

3.  Customized Clinical Programs – Better data management and detailed analytics enable clinical licensed pharmacists, whether at the PBM or within a specialized advisory firm, to recommend, implement, and manage customized clinical programs based on the plan sponsors unique population. Examples of this include opioid management, diabetes management, and oncology programs.

4.  Lower Pharmacy Costs – A carved-out PBM contract allows for aggressive price negotiations and more competitive Request For Proposals (RFPs). Separating the medical and prescription drug benefits enables a plan sponsor to compare pricing for both benefits on an apples-to-apples basis. A direct PBM contract will also include the critical terms that govern pricing, including discounts, rebates and soft dollar programs. In addition, administrative costs are not hidden within the healthcare benefits fee. Carved-in plans have increased fees and costs that reflect the health plan receiving compensation from their PBM arrangement.

Click here to register: “How To Slash the Cost of Your PBM Service, up to 50%, Without Changing Providers or Employee Benefit Levels.” [Free Webinar]

5.  Improved Data Management – Stand-alone PBMs with carved-out plans and direct contracts with plan sponsors capture and report all claims elements, allowing for accurate modeling, forecasting, and strategic planning. Data feeds and FTP interfaces between the PBM and the medical claims administrator allow automated delivery of pharmacy benefit claims and integration with medical claims. Plan sponsors and advisors can use the combined analytics to track trends and make informed benefit decisions.

6.  More Detailed Analytics – The enhanced data management described above means more detailed reporting capabilities, more sophisticated analytical tools, and more accurate forecasting and modeling. All of these contribute to lower annual drug spend and better long-term planning.

7.  Transparency – A carved-in plan has little or no transparency for the cost of the prescription drugs, the size of the mark-up, the rebates earned by the health plan, the contract volume pricing concessions negotiated by the health plan, or other financial incentives, all of which drive up cost to the plan sponsor. The health plan administrator provides none of the details critical to lowering cost, managing risk, and creating better clinical outcomes.

Medical and prescription benefits are completely different. The core strength of health plans and medical carriers is managing discounts with hospital chains and building provider networks. These skills are not transferable to managing prescription drug benefits, which are very different and, in many ways, more complex and more dynamic.

Driven principally by specialty pharmaceuticals, pharmacy benefit costs are forecast to increase between 15 and 18% per year for the foreseeable future. By carving out pharmacy benefits, plan sponsors create the potential to save up to 50% per year on pharmacy benefits service costs.

Repackaging: A “Traditional” Pharmacy Benefit Manager’s Black Box Tactic [Video]

Repackaging typically occurs when a company buys a large bottle of a prescription medication such as Lisinopril, and makes it into smaller bottle sizes. So, if a company buys a 1000 count bottle of Lisinopril and simply divides it into 10 bottles of 100, this is repackaging.
The new bottle of 100 is given a new NDC or national drug code and a new price. The new price is at the discretion of the re-packager and most likely higher than the original price. Watch the video below for a detailed illustration.
An even bigger problem (as if the repackaging wasn’t enough) is that most drug pricing for consumer plans are based upon AWP minus a certain percentage. When drugs are purchased, especially through mail order, the payer will not know if the AWP used in the cost formula was derived from an AWP reporting service such as Medispan or newly created as a result of repackaging.
The best means to determine if a medication was repackaged is to compare the NDC from the resulting claim to the manufacturer or distributor NDC. Traditional PBMs will not share this information with you. Fiduciary PBMs such as TransparentRx, LLC, will.

Reference Pricing: Pharmacy Invoice Cost (ACTUAL) for Top Selling Generic and Brand Prescription Drugs

Why is this document important?  Healthcare marketers are aggressively pursuing new revenue streams to augment lower reimbursements provided under PPACA. Prescription drugs, particularly specialty, are key drivers in the growth strategies of PBMs, TPAs and MCOs pursuant to healthcare reform. 

The costs shared below are what our pharmacy actually pays; not AWP, MAC or WAC.  The bottom line; payers must have access to “reference pricing.” Apply this knowledge to hold PBMs accountable and lower plan expenditures for stakeholders. 

Note: This document is updated weekly to reflect changing prices and new products.

How to Determine if Your Company [or Client] is Overpaying
Step #1:  Obtain a price list for generic prescription drugs from your broker, TPA, ASO or PBM every month.

Step #2:  In addition, request an electronic copy of all your prescription transactions (claims) for the billing cycle which coincides with the date of your price list.

Step #3:  Compare approximately 10 to 20 prescription claims against the price list to confirm contract agreement.  It’s impractical to verify all claims, but 10 is a sample size large enough to extract some good assumptions.

Step #4:  Now take it one step further. Check what your organization has paid, for prescription drugs, against our pharmacy cost then determine if a problem exists. When there is a 5% or more price differential (paid versus actual cost) we consider this a problem.

 
Multiple price differential discoveries means that your organization or client is likely overpaying. REPEAT these steps once per month.
 
— Tip —
 
Always include a semi-annual market check in your PBM contract language. Market checks provide each payer the ability, during the contract, to determine if better pricing is available in the marketplace compared to what the client is currently receiving. 

When better pricing is discovered the contract language should stipulate the client be indemnified. Do not allow the PBM to limit the market check language to a similar size client, benefit design and/or drug utilization.  In this case, the market check language is effectually meaningless.


Click here to register: “How To Slash the Cost of Your PBM Service, up to 50%, Without Changing Providers or Employee Benefit Levels.” [Free Webinar]

National Health Expenditure Projections 2013-2023

Major Findings

  • Health spending is projected to grow at an average rate of 5.7 percent for 2013-2023, 1.1percentage points faster than expected average annual growth in the Gross DomesticProduct (GDP).
  • Health spending growth for 2013 is projected to have remained slow at 3.6 percent due tothe modest economic recovery, the impacts of sequestration and continued slow growth in the utilization of Medicare services, and continued increases in cost-sharing requirements for the privately insured.
  • Improving economic conditions, the Affordable Care Act (ACA) coverage expansions, and the aging of the population, drive faster projected growth in health spending in 2014 and beyond.
    • Expected growth for 2014 is 5.6 percent, as 9 million Americans are projected to gain health insurance coverage, predominantly through Medicaid or the Health Insurance Marketplaces.
    • Average annual projected growth of 6.0 percent per year is projected for 2015 through 2023, largely as a result of the continued implementation of the ACA coverage expansions, faster projected economic growth, and the aging of the population. While projected growth is faster compared to recent experience, it is still slower than the growth observed over the longer-term history.
    • The number of uninsured people is expected to decline from 45 million people in 2012 to 23 million people by 2023.
    • By 2023, health expenditures financed by federal, state, and local governments are projected to account for 48 percent of national health spending and to reach a total of $2.5 trillion; in 2012, such expenditures constituted 44 percent of national health spending and $1.2 trillion.
  • Health spending is projected to be 19.3 percent of GDP by 2023, up from 17.2 percent in 2012.

Major Findings by Payer

Medicare

  • Due to a deceleration in growth driven by sequestration and lower utilization across services, Medicare spending growth is projected to have slowed to 3.3 percent in 2013, down from 4.8 percent growth in 2012, and to have totaled $591.2 billion.
  • Projected Medicare spending growth of 4.2 percent in 2014 reflects both an expected  increase in use and intensity of Medicare services, alongside slow increases in payment rates. For 2015, Medicare growth is projected to slow to 2.7 percent, mostly due to lower payments to Medicare Advantage plans.
  • For 2016 through 2023, projected Medicare spending growth is expected to rebound to 7.3 percent per year due to increased enrollment by the baby boomers, increased utilization of care, and higher payment rates driven by improved economic conditions, which increase growth in the cost of input goods and services used to treat Medicarepatients. These drivers in growth will be partially offset by slow growth in payment updates due to provisions in the Affordable Care Act and sequestration.

Medicaid

  • Medicaid spending is anticipated to have grown 6.7 percent and to have reached $449.5 billion in 2013, driven by higher payments rates to primary care physicians called for in the Affordable Care Act, as well as actions by states that increased provider reimbursement rates and expanded benefits.
  • Total Medicaid spending is projected to grow 12.8 percent in 2014 due to increased enrollment of nearly 8 million beneficiaries. Primarily driving the increase in enrollment are states that chose to expand coverage to adults up to 138 percent of the federal poverty level.
  • As some states are expected to expand their Medicaid programs after 2014, an additional 8.5 million people are expected to enroll in the program by 2016. Medicaid spending is expected to grow by 6.7 percent in 2015, and 8.6 percent in 2016. For 2016 to 2023, Medicaid spending growth is projected to be 6.8 percent per year on average.

Private Health Insurance

  • Spending for total private health insurance premiums ($947.5 billion) is projected to have grown by 3.3 percent in 2013, or about the same rate of growth as was observed for 2012. Premiums in 2013 are expected to grow slightly faster than benefits (3.0 percent) due to 6.0 percent growth in the net cost of private health insurance, an increase from 0.1 percent growth in 2012.
  • Private health insurance premium growth is projected to reach 6.8 percent in 2014 due to higher per enrollee spending and increased enrollment through Marketplace plans.
  • Private health insurance spending growth is expected to remain somewhat elevated at 6.9 percent in 2015, primarily due to additional enrollment into health insurance plans. For 2016 through 2023, after the ACA-related enrollment shifts play out, the effects of improved economic conditions are expected to sustain average private health insurance spending growth of 5.4 percent per year.

Out-of-Pocket

  • In 2013, out-of-pocket spending is projected to have grown 3.2 percent, slightly slower than the growth rates in 2011 and 2012, and to have reached $338.6 billion. Relatively slow growth in out-of-pocket spending is due to low growth in utilization, and higher cost-sharing requirements for the insured, which tend to discourage people from using covered services.
  • Out-of-pocket spending growth is projected to decrease by 0.2 percent in 2014 as a result of the Affordable Care Act’s coverage expansions.
  • While out-of-pocket spending growth is projected to accelerate after 2015, reaching a peak of 5.8 percent in 2020, the out-of-pocket share of health spending is projected to fall from 11.7 percent in 2013 to 9.9 percent by 2023.

Major Findings by Sector

Hospital

  • Total hospital spending is anticipated to have slowed to 4.1 percent in 2013, reaching $918.8 billion, compared with 4.9 percent growth in 2012. This would represent the fourth consecutive year that hospital spending growth has been under 5 percent after averaging 7.2 percent for 2001 through 2009.
  • In 2014, hospital spending growth is projected to be 4.5 percent, which largely reflects greater use of hospital services associated with the coverage expansions from the Affordable Care Act.
  • In 2015, hospital spending is projected to increase 5.1 percent due to the continued effects of the ACA insurance expansion combined with the effect of faster economic growth. For 2016 through 2023, continued population aging and the impacts of improved economic conditions are expected to result in projected average annual growth of 6.2 percent.

Physician and Clinical Services

  • Growth in spending on physician and clinical services (583.9 billion) is projected to have decelerated in 2013 to 3.3 percent, after growth of 4.6 percent in 2012 (and would mark the fifth consecutive year this rate would be below 5.0 percent). This trend is related to the slowest growth in physician prices since 2002, which is due in part to the sequester and procedural payment changes in Medicare.
  • In 2014, physician and clinical services spending growth is projected to be 5.9 percent. As many of the newly insured are anticipated to be generally younger, on average, compared to the current Medicaid and private insurance populations, they are expected to devote a relatively larger share of their medical spending to prescription drugs and physician and clinical services than to hospital care.
  • For 2015, lower payments to Medicare Advantage plans, as well as expiration of temporary payment increases to Medicaid providers, is expected to slow growth to 3.8 percent for physician and clinical services.
  • For 2016-2023 Medicare spending on physician and clinical services is projected to average 7.1 percent due to more favorable economic conditions and higher enrollment in private health insurance plans.

Prescription Drugs

  • In 2013, prescription drug spending is projected to have grown 3.3 percent (reaching $272.1 billion), compared to 0.4 percent growth in 2012. The projected acceleration is due to a smaller descending impact on growth from patent expirations (many of which exerted significant downward pressure on growth in 2011 and 2012) and increased utilization of prescription drugs.
  • Projected prescription drug spending growth is 6.8 percent for 2014, and 6.4 percent in 2015, driven by increases in the use of prescription drugs among people who are newly insured and those who move to more generous insurance plans as a result of the premium and cost-sharing subsidies offered by the Affordable Care Act.
  • Prescription drug spending is projected to average 5.4 percent for 2016 through 2019 and 6.0 percent for 2020-2023. Faster growth is projected for 2020-2023 due to improving economic conditions, an expected rising trend of expensive specialty drugs being purchased through retail channels, and anticipated changing clinical guidelines designed to encourage drug therapies at earlier stages of treatment.

Major Findings by Sponsor

  • Health care spending sponsored (or financed) by federal, state, and local governments is projected to have grown 3.2 percent (to $1.3 trillion) in 2013.
  • Reflecting growth trends in private health insurance and out-of-pocket spending, outlays by businesses, households, and other private sources are projected to have risen by 3.9 percent in 2013, compared to 4.6 percent in 2012, and to have reached $1.6 trillion in 2013.
  • For 2014, health care financing is projected to shift from households towards the federal government due to features of the Affordable Care Act coverage expansions, such as the 100-percent initial federal matching rate for newly eligible Medicaid enrollees, and subsidies for Marketplace coverage. As a result, the federal government’s share of spending is projected to increase to 28 percent in 2014, from 26 percent in 2013.
  • The government-sponsored share of health spending is projected to increase and account for 48 percent of national health expenditures by 2023, largely driven by Medicaid coverage expansions, Marketplace plan premium and cost-sharing subsidies, and an increasing gap between dedicated Medicare financing and program outlays.

Source:  Centers for Medicare and Medicaid Services

Reference Pricing: Pharmacy Invoice Cost (ACTUAL) for Top Selling Generic and Brand Prescription Drugs

Why is this document important?  Healthcare marketers are aggressively pursuing new revenue streams to augment lower reimbursements provided under PPACA. Prescription drugs, particularly specialty, are key drivers in the growth strategies of PBMs, TPAs and MCOs pursuant to healthcare reform. 

The costs shared below are what our pharmacy actually pays; not AWP, MAC or WAC.  The bottom line; payers must have access to “reference pricing.” Apply this knowledge to hold PBMs accountable and lower plan expenditures for stakeholders.

How to Determine if Your Company [or Client] is Overpaying
Step #1:  Obtain a price list for generic prescription drugs from your broker, TPA, ASO or PBM every month.

Step #2:  In addition, request an electronic copy of all your prescription transactions (claims) for the billing cycle which coincides with the date of your price list.

Step #3:  Compare approximately 10 to 20 prescription claims against the price list to confirm contract agreement.  It’s impractical to verify all claims, but 10 is a sample size large enough to extract some good assumptions.

Step #4:  Now take it one step further. Check what your organization has paid, for prescription drugs, against our pharmacy cost then determine if a problem exists. When there is a 5% or more price differential (paid versus actual cost) we consider this a problem.

 
Multiple price differential discoveries means that your organization or client is likely overpaying. REPEAT these steps once per month.
 
— Tip —
 
Always include a semi-annual market check in your PBM contract language. Market checks provide each payer the ability, during the contract, to determine if better pricing is available in the marketplace compared to what the client is currently receiving. 

When better pricing is discovered the contract language should stipulate the client be indemnified. Do not allow the PBM to limit the market check language to a similar size client, benefit design and/or drug utilization.  In this case, the market check language is effectually meaningless.


Click here to register: “How To Slash the Cost of Your PBM Service, up to 50%, Without Changing Providers or Employee Benefit Levels.” [Free Webinar]

Generic Drug Field Full of Pricing Traps

Foreword: The zero-spread full pass through pharmacy benefits manager (PBM) program you were promised may not be all that it appears. The only way to guarantee (or at least have grounds for indemnification) is to do business with a fiduciary PBM; one that contractually agrees to always put its clients’ needs first. By the way, I predicted both the rising cost of generic drugs and increased number of drug tiers last year!

*********************************************************************************

A friend of mine, a diabetic, stumbled on to another booby trap in the pricing of generic drugs. In my last column I described the new two-tiered arrangements insurers are pushing on patients. You can choose a non-preferred generic and pay more, maybe a lot more, or a preferred generic and get a price break. That’s the same pricing scheme insurers use for the expensive brand-name drugs.

Rising costs are a direct result of demand

Consumer groups, doctors, and insurance carriers have encouraged patients to choose generics over the name brands as a way to help lower the nation’s healthcare tab. So for many years my friend has been using a generic drug called Gemfibrozil that diabetics often take to lower triglycerides and cholesterol.

It has worked for him. No nasty drug interactions. No nasty side effects. And the price has been low–$2.71 for 60 pills. In August the price more than doubled to $6.14. He was still OK with that.

He was not OK when he got a bill in September from Express Scripts, the pharmacy benefit manager for his Medigap carrier whose plan is offered by his former employer, the City of New York. (PBMs, as they’re called, manage the drug benefits for employers and insurers and supposedly help hold the line on prices.)

Express Scripts wrote his doctor without consulting my friend, the patient, suggesting that for reasons of “safety and efficacy,” he should switch his patient to a different drug, a generic called Fenofibric acid. His share of the cost would now be $156.70 for 90 pills. Fenofibric acid costs $1.74 per pill compared to Gemfibrozil’s 10 cents a pill resulting in an out-of-pocket cost increase of 1,640 percent.

Why the switch, my friend asked his doctor. The doctor pointed to the reasons given in the letter about an increased risk of skeletal muscle effects and said maybe it was advisable to try the new drug. He was, however, astounded by the price, but my friend said it was clear the doctor wasn’t going to fight the PBM.

My friend spoke to an official at New York City’s employee benefits office who said her office has never heard of a PBM recommending that a more expensive generic drug replace a cheaper one.

I rang up John Rother, former chief lobbyist for AARP and now head of a group called the National Coalition on Health Care. The Coalition is waging a campaign to educate the public about the exorbitant prices of drugs, particularly the Hepatitis C drug Sovaldi and other specialty drugs in the pipeline that will carry super high price tags.

“Generic drug prices have been rising steeply, and there doesn’t seem to be an explanation for it,” Rother told me. He said he could only guess that some generic drug makers are leaving the market and the ones remaining will have less competition and the power to increase market share and raise prices.

Maybe there are medical reasons my friend should make the switch, but so far his doctor hasn’t been persuasive. Has the PBM discovered new side effects for the drug he’s been taking? Who’s treating the patient—the doctor or the PBM? And how does this big price jump fit in with the PBM’s purported mission: to save money for insurers and employers? Was my friend caught in a tussle between the clinician and the bean counters? How does he know who’s right without doing extensive research himself?

Since individuals can’t negotiate prices with drug companies, and Congress has prohibited Medicare from negotiating prices when it passed the prescription drug benefit law in 2003, my friend says, “companies have carte blanche to rip people off. In situations like this no one ever talks straight, but someone is making a lot more money.” He’s trying to get back on Gemfibrozil or a similar generic that’s cheaper than the one the PBM suggested.

Rother looks at the big picture now coming into focus from the sharply rising prices of generics. “Four years after we passed what we thought was universal health coverage, you can’t get the medicines you need because of the prices. It’s tragic,” he says.

By Trudy Lieberman, Rural Health News Service

Click here to register: “How To Slash the Cost of Your PBM Service, up to 50%, Without Changing Providers or Employee Benefit Levels.” [Free Webinar]

Reference Pricing: Pharmacy Invoice Cost (ACTUAL) for Top Selling Generic and Brand Prescription Drugs

Why is this document important?  Healthcare marketers are aggressively pursuing new revenue streams to augment lower reimbursements provided under PPACA. Prescription drugs, particularly specialty, are key drivers in the growth strategies of PBMs, TPAs and MCOs pursuant to healthcare reform. 

The costs shared below are what our pharmacy actually pays; not AWP, MAC or WAC.  The bottom line; payers must have access to “reference pricing.” Apply this knowledge to hold PBMs accountable and lower plan expenditures for stakeholders.

How to Determine if Your Company [or Client] is Overpaying
Step #1:  Obtain a price list for generic prescription drugs from your broker, TPA, ASO or PBM every month.

Step #2:  In addition, request an electronic copy of all your prescription transactions (claims) for the billing cycle which coincides with the date of your price list.

Step #3:  Compare approximately 10 to 20 prescription claims against the price list to confirm contract agreement.  It’s impractical to verify all claims, but 10 is a sample size large enough to extract some good assumptions.

Step #4:  Now take it one step further. Check what your organization has paid, for prescription drugs, against our pharmacy cost then determine if a problem exists. When there is a 5% or more price differential (paid versus actual cost) we consider this a problem.

 
Multiple price differential discoveries means that your organization or client is likely overpaying. REPEAT these steps once per month.
 
— Tip —
 
Always include a semi-annual market check in your PBM contract language. Market checks provide each payer the ability, during the contract, to determine if better pricing is available in the marketplace compared to what the client is currently receiving. 

When better pricing is discovered the contract language should stipulate the client be indemnified. Do not allow the PBM to limit the market check language to a similar size client, benefit design and/or drug utilization.  In this case, the market check language is effectually meaningless.


Click here to register: “How To Slash the Cost of Your PBM Service, up to 50%, Without Changing Providers or Employee Benefit Levels.” [Free Webinar]


Can Specialty Pharmacies Ease the Pain Of Soaring Deductibles?

The growing move among employers to adopt high-deductible health plans is one of the major “trends that matter” to specialty pharmacy in today’s stormy health care environment, according to Myrtle Potter, a health care consultant and former Big Pharma executive who offered some tips for navigating this challenge at the 2014 Armada Specialty Pharmacy Summit.

In 2013, Ms. Potter noted, 17% of employers offered high-deductible health plans as their employees’ only option—up 31% from 2012, according to PricewaterhouseCoopers’ “Behind the Numbers 2014.” For 2014, she said, some 44% of employers were considering such a move (http://pwc.to/​1eRYLxr).

High-deductible plans can pose challenges for anyone with a chronic condition, but they are particularly problematic for patients taking expensive specialty medications, with annual minimum deductibles of $1,250 per person and $2,500 per family. The 2014 annual cap on out-of-pocket costs is $6,350 for an individual and $12,700 for a family—high for anyone, but harder to swallow if it’s front-loaded into the first month or two of each year because of costly specialty drugs.

Those steep costs can be a powerful trigger for noncompliance. In one study, high-deductible health plans were found to reduce adherence to prescription medication regimens in four of five conditions evaluated: hypertension, dyslipidemia, diabetes and depression (Am J Managed Care 2013;19:e400-e407), Ms. Potter noted. Only in asthma/chronic obstructive pulmonary disease was there not a significant decline in adherence.

The conditions included in the compliance study generally do not require specialty medications, Ms. Potter pointed out; it’s thus possible that the documented adherence problems might be even more pronounced when it comes to specialty medications, “particularly because few of these drugs have generic alternatives in a lower tier, and patients may have to pay $7,600 or more per year out of pocket for specialty medications,” she said.

Health Exchanges Not Immune

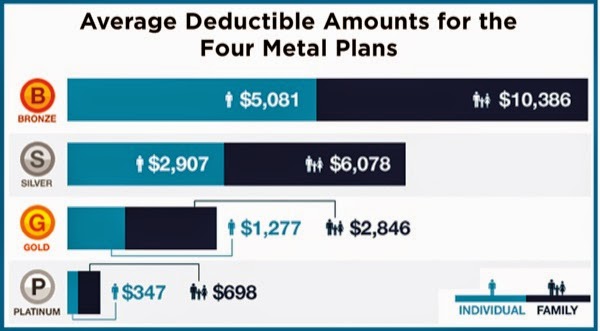
If employer-sponsored plans are increasingly moving toward high deductibles, many plans on the new health insurance exchanges—especially at the lower bronze “metal level”—are already there. In December, HealthPocket Inc., which compares health insurance plans for consumers, found that the average annual individual deductible for a bronze plan was just over $5,000, in addition to the average premium of $295.51 a month, or $3,546 a year (http://bit.ly/​1oevFqq).

“These high-deductible plans are causing a bit of a problem,” Debbie Stern, president of Rxperts, told Specialty Pharmacy Continuum. “It’s really putting a high burden on the patient to come up with all of that up front. Even if it’s just a $2,000 deductible, the patient has to pay that up front almost immediately for most specialty drugs, so the first prescription is going to cost them almost the full out-of-pocket for the year. When these plans were designed, people were thinking of drugs that cost $200 a month, not specialty drugs that cost $2,000 a month or more.”

Here’s where good specialty pharmacies can really distinguish themselves, Ms. Potter said. “You can provide additional patient support, working proactively to help patients understand their medical plans and anticipate their financial demands.” (See sidebar for more details on these strategies.)

That’s already happening at many specialty pharmacies around the country, according to Kyle Skiermont, PharmD, the director of specialty/infusion operations at Fairview Pharmacy Services in Minneapolis. “We’re seeing a big increase in high-deductible plans, along with a rise of coinsurance,” Dr. Skiermont said. “We’re seeing both more patients with these plans, as well as higher dollar amounts they’re needing.”

Fairview has doubled its staff of patient financial advocates over the past year to help address the growing need. And it’s not just that more patients need assistance—their situations are also becoming more and more complicated, Dr. Skiermont noted. “Where one advocate might have been able to handle many more patients in the past,” he said, “each patient we are helping is taking more time and getting more complex in [his or her] needs.”

Many of the foundations and other sources of funding for medication assistance are also getting tapped out more quickly. That, too, requires creativity. “Some foundations recharge their funds over the year, so if you ask for a grant on behalf of your patient and it’s not there, you need to know when to go back to them,” Dr. Skiermont said. “Maybe there was no funding in March but there may be in October. It requires a lot more interaction and advocacy for our patients, multiple times a year, whereas historically we might have only needed to do that once a year.”

“We’ve been getting more and more creative around what we can do as far as payment plans,” Dr. Skiermont added. “If we know someone has a big out-of-pocket maximum that they’re going to hit in the first month, we’ll try to make arrangements to pay that over the year.”

It’s a patchwork solution that likely is not sustainable in the long term. “In the short term, we feel we owe this to our patients. As a nonprofit, health-system–based specialty pharmacy, providing this kind of high-touch financial assistance is one of our differentiators.

It’s core to our mission,” Dr. Skiermont said. “We need to continue to be innovative and make this work for our patients, but ultimately something is going to have to change. A lot of the burden is falling on specialty pharmacy, but at the same time, the providers and the pharmaceutical companies are beginning to understand the coverage issues better than they did a couple of years ago, and are helping us bring the message to the patient. The reality is that everyone’s still trying to figure this out.”

by Gina Shaw