Because plan sponsors don’t know how to calculate how much money PBMs make, it gives PBMs all the incentive they need to overcharge. How many businesses do you know want to cut their revenues in half? That’s why traditional pharmacy benefit managers, and their stakeholders, don’t offer a fiduciary standard of care and instead opt for hidden cash flow opportunities to generate their service fees. Want to learn more?
“Thank you, Tyrone, for this informative meeting.” David Wachtel, VP
“…Great presentation! I had our two partners at the presentation as well. Very informative.” Nolan Waterfall, Agent/Benefits Specialist
A snapshot of what you will learn during this 30-minute webinar:
Hidden cash flows in the PBM Industry
Basic to intermediate level PBM terminologies
Specialty pharmacy cost-containment strategies
Examples of drugs that you might be covering that are costing you
The #1 metric to measure when evaluating PBM proposals
Understanding how pharmacy benefit managers make money and how much you pay them for their services is a key element in running an efficient pharmacy benefits program. Join us to learn more.
Anti-competitive PBM Practices Harming Patients, Payers, and Pharmacies, APCI Tells FTC and other notes from around the interweb:
Federal Judge Strikes Down CMS’ Medicaid Copay Rule, Handing Drugmakers Major Win. In 2021, the pivot to biosimilar preference was significant and rapid. Beyond the increased numbers of new biosimilar approvals and launches, important new biosimilars were approved, and use of biosimilars increased in 2021, beginning with the FDA decisions to give interchangeability designations to two biosimilars. The interchangeable designation speeds up access by allowing pharmacies to dispense biosimilars in place of “originators” — the brand-name products that the biosimilars are copies of — without physician consent. Interchangeable status was granted for biosimilars of Lantus (insulin glargine) and Humira (adalimumab), although the Humira biosimilars won’t be on the market till next year.
Anti-competitive PBM Practices Harming Patients, Payers, and Pharmacies, APCI Tells FTC. In addition to urging the FTC to act against PBMs in its comments, APCI also included a laundry list of examples of commonly used PBM practices that are harmful to patients, taxpayers, and small businesses. The co-op detailed practices such as drug coverage decisions that force patients to obtain far more expensive brand-name medications when cheaper generic medications are available; utilizing secretive reimbursement methods that inflate prescription drug prices; and steering patients to PBM owned/affiliated mail order pharmacies, specialty pharmacies, and retail pharmacies.
CMS Finalizes Changes to Pharmacy DIR in Part D Starting with Contract Year 2024. Changes in the final rule mean that pharmacies will be able to see, at the point of sale, the “lowest possible reimbursement” for a Part D drug, which will now reflect any pharmacy price concession in that value. CMS states the final rule is a win for patients who will see lower out-of-pocket costs at the pharmacy, which it estimates to save patients over $26 billion between 2024 and 2032. Some pharmacy advocates also claim the final rule is an important step to bring transparency to pharmacy negotiated prices.
$350 Billion in Health Care Rebates Go to Middlemen. In 2021, my company, Sanofi, paid more than $14 billion – about 50 cents of every dollar we earned on our medicines – in discounts and rebates to these middlemen with the purpose of ensuring patients can get the medicines they need at the lowest possible price. We’ve been transparent with this data for several years and updated it in our just released annual Pricing Principles report. Across the entire industry, the figure that was paid by manufacturers in 2021 in rebates and discounts was $350 billion. That’s more money than the NFL made, in total, over the course of Tom Brady’s 22-year career.
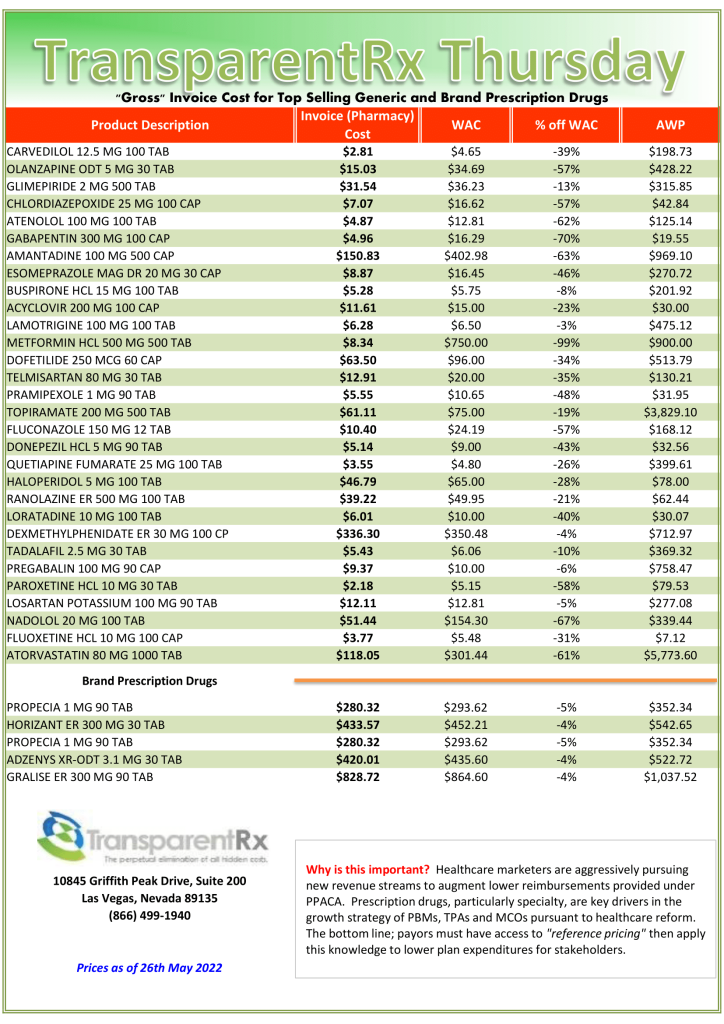
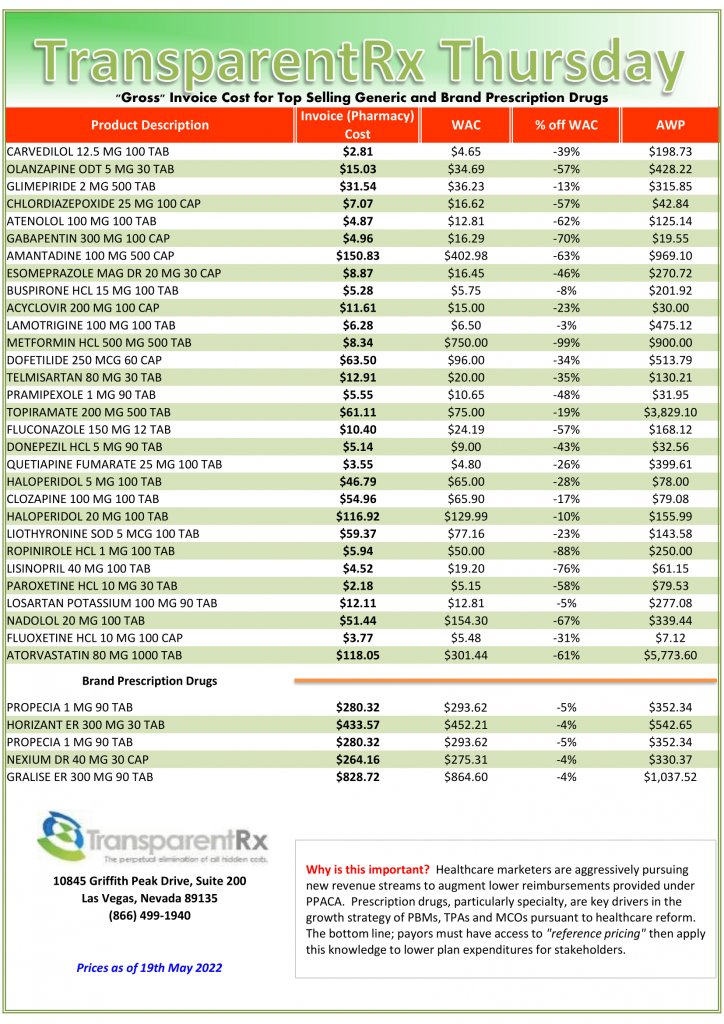
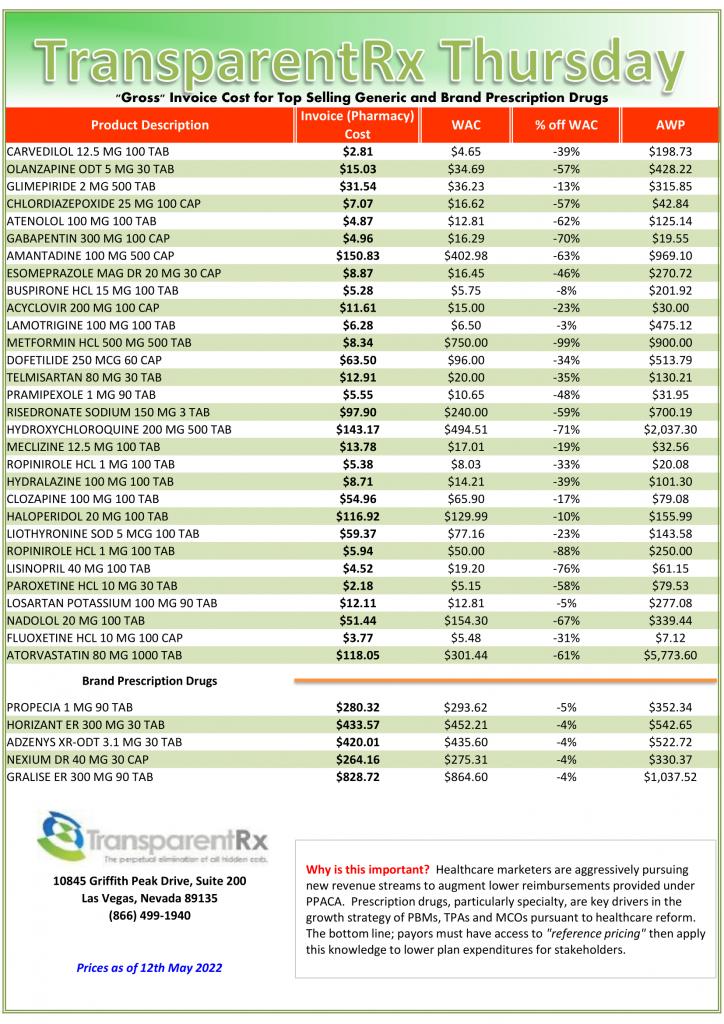
This document is updated weekly, but why is it important? Healthcare marketers are aggressively pursuing new revenue streams to augment lower reimbursements provided under PPACA. Prescription drugs, particularly specialty, are key drivers in the growth strategies of PBMs, TPAs, and MCOs pursuant to health care reform.
How to Determine if Your Company [or Client] is Overpaying
Step #1: Obtain a price list for generic prescription drugs from your broker, TPA, ASO or PBM every month.
Step #2: In addition, request an electronic copy of all your prescription transactions (claims) for the billing cycle which coincides with the date of your price list.
Step #3: Compare approximately 10 to 20 prescription claims against the price list to confirm contract agreement. It’s impractical to verify all claims, but 10 is a sample size large enough to extract some good assumptions.
Step #4: Now take it one step further. Check what your organization has paid, for prescription drugs, against our acquisition costs then determine if a problem exists. When there is more than a 5% price differential for brand drugs or 25% (paid versus actual cost) for generic drugs we consider this a potential problem thus further investigation is warranted.
Multiple price differential discoveries mean that your organization or client is likely overpaying. REPEAT these steps once per month.
— Tip —
Always include a semi-annual market check in your PBM contract language. Market checks provide each payer the ability, during the contract, to determine if better pricing is available in the marketplace compared to what the client is currently receiving.
Idioms like “hang your hat on” come in handy when you write or talk a lot. One of my other favorites is talk is cheap. Having the right information, however, is invaluable when you know how to interpret it and then create a plan. Where pharmacy benefits are concerned, look no further than these 6 PBM performance metrics for your competitive advantage.
In her book, Competitive Intelligence Advantage, Seena Sharp wrote, “Companies often downplay intelligence, believing their competitors to have access to the same information. Well, everyone also has access to a wide array of fruits and vegetables, yet many don’t eat them or eat very few. Access does not translate into action. Your competitive advantage includes executing good analysis of the right information and then figuring out what all of this means for your company…Those who seize the opportunity and develop an effective plan that can be accomplished have a significant competitive advantage.”
BER (Brand Effective Rate) means the average percent discount off the AWP for all brand drugs (as determined by a price reporting service such as Medispan) for each reporting period i.e. monthly, quarterly etc. Break out by channel i.e. retail 30, specialty etc. and don’t permit any cost offsets. Cost offsets permit performance overages in one channel to be added to underperformance in a different channel. Goal > 18%.
GER (Generic Effective Rate) is the average percent discount off the AWP for all generic drugs whether reimbursed at MAC, usual and customary pricing, or AWP discount. Because nine out of ten dispensed drugs are generic, the GDR performance metric is especially important. It can be difficult to catch where you are losing money until it is too late. You want to catch overpayments early enough to make the proper adjustment(s). Continuously monitor your GER so any overpayments to PBMs don’t pile up. Analyze performance by channel i.e. retail 30, retail 90 etc. Goal > 88%.
GDR (Generic Dispense Rate) or generic dispensing ratio is the number of generic fills divided by the total number of prescriptions. GDR is a standard performance metric on which our formulary managers are regularly evaluated. For every 1% increase in GDR a plan can expect to realize a 2.5% reduction in gross drug spend. Both GDR and GSR are indicators of how well clinical programs are performing. For example, loose utilization management will produce a low GDR. Goal > 90%.
GSR (Generic Substitution Rate) is the rate at which generic drugs are dispensed in place of their brand equivalents. To calculate GSR, divide the number of generic drug prescriptions by the total of all multisource prescriptions (both generic and multisource brand). Goal > 97.5%.
MER (MAC Effective Rate) is the average percent discount off the AWP for drugs processed by the MAC list to be applied to your organization. MAC lists are proprietary to each PBM, so MAC’d drugs and their corresponding prices are set by PBMs. MAC or maximum allowable cost is used to establish an upper limit the PBM will reimburse a pharmacy and subsequently bill its clients for branded drugs and their multi-source and authorized generics. Non-fiduciary PBMs can have multiple MAC lists. For brokers and consultants, MER is an excellent way to compare how MAC lists perform for multiple pharmacy benefit managers. Goal > 90%.
PMPM (Per Member Per Month) is the most fundamental cost indicator for financial benchmarking in pharmacy benefits. As such, every proposal should include a projected PMPM. Additionally, incumbent PBM cost performance should be measured by change in PMPM YOY for both whole dollars and percentage. It is calculated by dividing the total annual cost or revenue by the number of member months. Goal < $100 PMPM.
Conclusion – 6 PBM performance metrics
Each goal provided above assumes clean claims. In other words, all claims are included and there are no reclassifications of any drugs. When running a comparative PBM analysis, make sure you are comparing apples to apples. PBMs are notorious for reclassifying drugs, reducing claim counts and other tricks to make their numbers look better than how they performed. The Pharmacy Benefit Manager Transparency Act of 2022could very well be the first stage of failure for bad actors. It targets the profits of non-fiduciary pharmacy benefit managers. Is this game over?
CMS’ Medicaid copay rule struck down by Federal judge, handing drugmakers major win and other notes from around the interweb:
Federal Judge Strikes Down CMS’ Medicaid Copay Rule, Handing Drugmakers Major Win. In 2021, the pivot to biosimilar preference was significant and rapid. Beyond the increased numbers of new biosimilar approvals and launches, important new biosimilars were approved, and use of biosimilars increased in 2021, beginning with the FDA decisions to give interchangeability designations to two biosimilars. The interchangeable designation speeds up access by allowing pharmacies to dispense biosimilars in place of “originators” — the brand-name products that the biosimilars are copies of — without physician consent. Interchangeable status was granted for biosimilars of Lantus (insulin glargine) and Humira (adalimumab), although the Humira biosimilars won’t be on the market till next year.
Trends in Specialty Benefit Design Report Published by Pharmaceutical Strategies Group. Extensive research about the latest trends in specialty benefit design launches today. Pharmaceutical Strategies Group (PSG), an EPIC company, developed the Trends in Specialty Benefit Design Report. This proprietary research delivers detailed intelligence to enhance the ability of employers, labor groups, and other plan sponsors to unpack the specialty drug benefit design landscape. “There’s a little bit of irony—they’re worried about reducing patient out-of-pocket costs, but their benefit designs don’t necessarily reflect them,” added Lonergan. Regarding specialty drugs, Phares explained that the most commonly reported tool is cost sharing. In addition, in 2021 51% of plan sponsors said they were using coinsurance for specialty drug cost sharing, marking the first time that metric has surpassed 50%.
CMS Finalizes Changes to Pharmacy DIR in Part D Starting with Contract Year 2024. Changes in the final rule mean that pharmacies will be able to see, at the point of sale, the “lowest possible reimbursement” for a Part D drug, which will now reflect any pharmacy price concession in that value. CMS states the final rule is a win for patients who will see lower out-of-pocket costs at the pharmacy, which it estimates to save patients over $26 billion between 2024 and 2032. Some pharmacy advocates also claim the final rule is an important step to bring transparency to pharmacy negotiated prices.
$350 Billion in Health Care Rebates Go to Middlemen. In 2021, my company, Sanofi, paid more than $14 billion – about 50 cents of every dollar we earned on our medicines – in discounts and rebates to these middlemen with the purpose of ensuring patients can get the medicines they need at the lowest possible price. We’ve been transparent with this data for several years and updated it in our just released annual Pricing Principles report. Across the entire industry, the figure that was paid by manufacturers in 2021 in rebates and discounts was $350 billion. That’s more money than the NFL made, in total, over the course of Tom Brady’s 22-year career.
This document is updated weekly, but why is it important? Healthcare marketers are aggressively pursuing new revenue streams to augment lower reimbursements provided under PPACA. Prescription drugs, particularly specialty, are key drivers in the growth strategies of PBMs, TPAs, and MCOs pursuant to health care reform.
How to Determine if Your Company [or Client] is Overpaying
Step #1: Obtain a price list for generic prescription drugs from your broker, TPA, ASO or PBM every month.
Step #2: In addition, request an electronic copy of all your prescription transactions (claims) for the billing cycle which coincides with the date of your price list.
Step #3: Compare approximately 10 to 20 prescription claims against the price list to confirm contract agreement. It’s impractical to verify all claims, but 10 is a sample size large enough to extract some good assumptions.
Step #4: Now take it one step further. Check what your organization has paid, for prescription drugs, against our acquisition costs then determine if a problem exists. When there is more than a 5% price differential for brand drugs or 25% (paid versus actual cost) for generic drugs we consider this a potential problem thus further investigation is warranted.
Multiple price differential discoveries mean that your organization or client is likely overpaying. REPEAT these steps once per month.
— Tip —
Always include a semi-annual market check in your PBM contract language. Market checks provide each payer the ability, during the contract, to determine if better pricing is available in the marketplace compared to what the client is currently receiving.
A competitive bidding process is a frequent procurement practice that involves sending invitations to PBM vendors to submit proposals for their services. Competitive bidding, an RFP for example, is designed to allow equality of opportunity, the ability to demonstrate that the outcomes represent the best value, and transparency.
However, in a PBM competitive bidding process contract nomenclature often obscures the actual cost. What’s more a PBM could tell you it is pass-through or transparent and even include those terms in the contract yet behave very differently after the group goes live, for instance. Here are 5 questions to ask PBM finalists before announcing the winner of a competitive bidding process.
Information Failure. Is there any language in your contract which restricts access to our claims data in any way?
Network Spreads. Does the contract language bind you from keeping any differences in the amounts billed to us and the amounts reimbursed to pharmacies for identical claims?
Rebate Spreads. Does the contract language prevent you from paying us an amount less than the amount refunded to you by drug manufacturers or rebate aggregators for identical claims?
Utilization Management. Does the contract language prevent you from substituting a lower priced generic and therapeutically equivalent drug for a higher priced prescribed drug?
Formulary Management. Does the contract language prevent you from including on the formulary a higher priced brand drug when a lower priced generic and therapeutically equivalent drug is available?
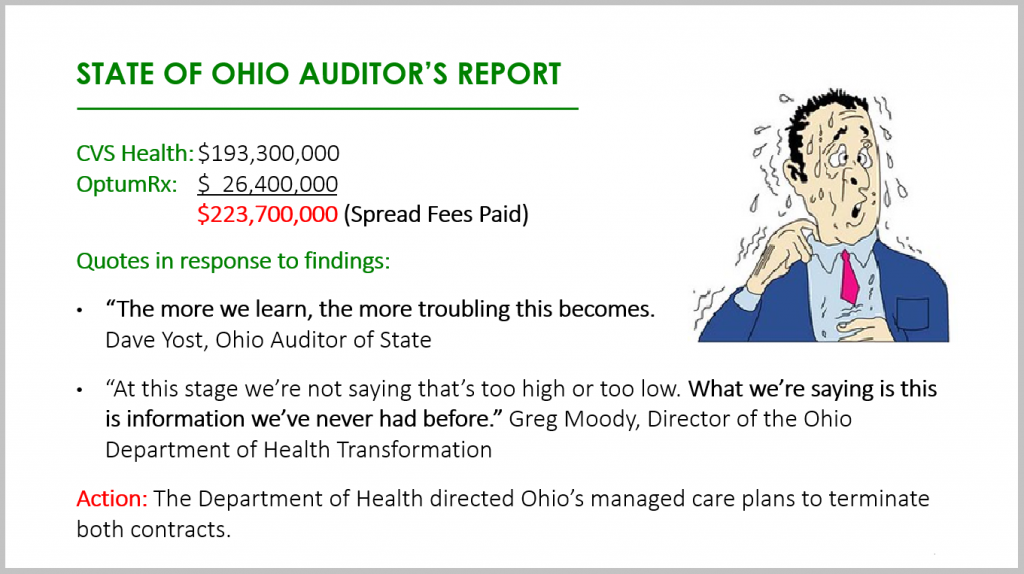
The State of Ohio had not asked all these questions before it paid out almost $250 million in network spreads alone! Its staff had inadequate knowledge of the PBM industry, especially around contracting. Drafting, negotiating, and finalizing a contract with a PBM are the three most important tasks during a competitive bidding process. Select finalists based on radically transparent contract terms with constituent elements spelled out. Do not select a winner based on non-binding pricing guarantees, unverifiable information, or optics.
5 Questions to Ask PBM Finalists Conclusion
PBMs provide transparency and disclosure to a level demanded by current and prospective clients for disclosure in negotiating their contracts. The best proponent of transparency and lowest net cost is educated purchasers of PBM services. The purchaser needs to understand not only what they want to achieve in their relationship with their PBM but also the competitive market and their ability to drive disclosure of details on outcomes important to them. The Certified Pharmacy Benefits Specialist (CPBS) certification is the only training program which puts brokers, consultants, and self-funded employers on a level playing field with PBMs.Click here to read a handful of CPBS course testimonials.
Trends in Specialty Benefit Design Report Published by Pharmaceutical Strategies Group and notes from around the interhttps://transparentrx.com/cpbs-certification/web:
Trends in Specialty Benefit Design Report Published by Pharmaceutical Strategies Group. Extensive research about the latest trends in specialty benefit design launches today. Pharmaceutical Strategies Group (PSG), an EPIC company, developed the Trends in Specialty Benefit Design Report. This proprietary research delivers detailed intelligence to enhance the ability of employers, labor groups, and other plan sponsors to unpack the specialty drug benefit design landscape. “There’s a little bit of irony—they’re worried about reducing patient out-of-pocket costs, but their benefit designs don’t necessarily reflect them,” added Lonergan. Regarding specialty drugs, Phares explained that the most commonly reported tool is cost sharing. In addition, in 2021 51% of plan sponsors said they were using coinsurance for specialty drug cost sharing, marking the first time that metric has surpassed 50%.
CMS Finalizes Changes to Pharmacy DIR in Part D Starting with Contract Year 2024. Changes in the final rule mean that pharmacies will be able to see, at the point of sale, the “lowest possible reimbursement” for a Part D drug, which will now reflect any pharmacy price concession in that value. CMS states the final rule is a win for patients who will see lower out-of-pocket costs at the pharmacy, which it estimates to save patients over $26 billion between 2024 and 2032. Some pharmacy advocates also claim the final rule is an important step to bring transparency to pharmacy negotiated prices.
Biosimilars Made a Significant Dent on 2021 Drug Spending. In 2021, the pivot to biosimilar preference was significant and rapid. Beyond the increased numbers of new biosimilar approvals and launches, important new biosimilars were approved, and use of biosimilars increased in 2021, beginning with the FDA decisions to give interchangeability designations to two biosimilars. The interchangeable designation speeds up access by allowing pharmacies to dispense biosimilars in place of “originators” — the brand-name products that the biosimilars are copies of — without physician consent. Interchangeable status was granted for biosimilars of Lantus (insulin glargine) and Humira (adalimumab), although the Humira biosimilars won’t be on the market till next year.
$350 Billion in Health Care Rebates Go to Middlemen. In 2021, my company, Sanofi, paid more than $14 billion – about 50 cents of every dollar we earned on our medicines – in discounts and rebates to these middlemen with the purpose of ensuring patients can get the medicines they need at the lowest possible price. We’ve been transparent with this data for several years and updated it in our just released annual Pricing Principles report. Across the entire industry, the figure that was paid by manufacturers in 2021 in rebates and discounts was $350 billion. That’s more money than the NFL made, in total, over the course of Tom Brady’s 22-year career.
Generic Substitution Rate (GSR) and employer-sponsored prescription drug costs go together like peanut butter and jelly or Glory green beans and meatloaf. If you’ve never tried Glory green beans pick up a couple of cans during your next trip to the supermarket. You will ditch Green Giant or Del Monte and never go back. Thank me later.
It is clear that every pharmacy benefit manager offers clinical services. These clinical services include but are not limited to formulary management and drug utilization management. Drug utilization management includes services such as prior authorization, step therapy, quantity limits, therapeutic substitution, dose optimization, refill to soon, and a host of others. What isn’t so clear is how does a self-insured employer or broker measure the performance of clinical services? Generic Substitution Rate (GSR) is the best metric for measuring PBM clinical management performance.
Clinical services are popular among purchasers of PBM services, yet their effectiveness remains a mystery to many. Let’s first review the Big Three for drug utilization management programs before diving into GSR and its significance. The Big Three includes prior authorization, quantity limits and step therapy services.
Prior Authorization (PA). Requires approval by the PBM or plan administrator before payment to the pharmacy is permitted. The drugs which require prior authorization or PA are high cost, have the potential for abuse or waste, or require monitoring to reduce the risk for dangerous side effects.
Quantity Limits (QL). A maximum quantity of drugs that can be dispensed to a patient at one time. The primary purpose of quantity limits is to reduce wasteful spending in the case a 90-day supply isn’t necessary, for instance. All specialty drugs should have a 30-day or less supply quantity limit.
Step Therapy (ST). Costly drugs are dispensed only when the patient has tried a less costly drug. For example, a lower cost specialty or non-specialty drug would be required before the more costly specialty drug is approved by the PBM or plan administrator. Some benefit designs may require failure on two or more drugs in a step therapy process before the costliest drug is approved.
I’m occasionally asked by brokers and plan administrators, “should we be tracking our Generic Substitution Rate?” My answer is always the same, an emphatic yes! Generic Dispense Rate (GDR) and Generic Substitution Rate are major contributors to PMPM plan cost. In fact, GDR and GSR are congruent. Because they work in harmony, high performance with GDR means the same for GSR and vice versa. GDR and GSR as major contributors to final plan costs is an understatement.
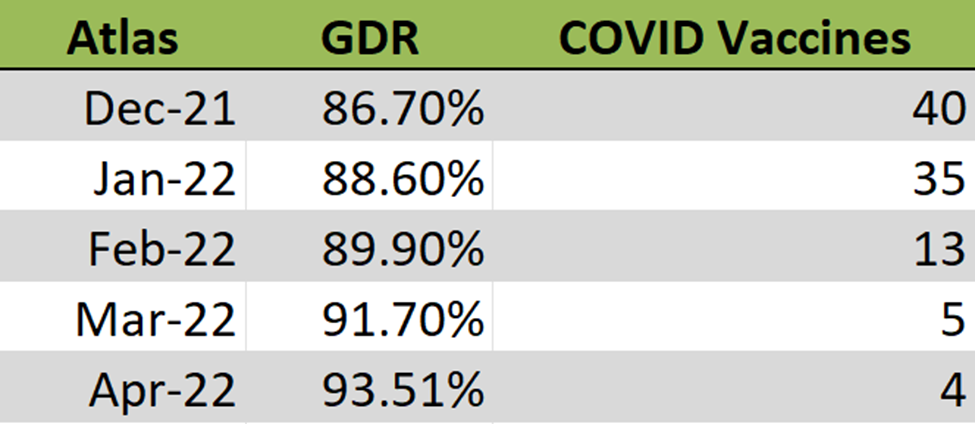
Figure 1. Generic Dispense Rate (GDR) Table
Figure 1 is the actual Generic Dispense Rate (GDR) performance from one of our clients. Generic Dispense Rate (GDR) is the percentage of all prescription drug fills that were for generics. For April, this client’s GDR was 93.5%. For every 1% increase in GDR a plan can expect to realize a 2.5% reduction in gross drug spend. Going from an 80% to 90% GDR means a $500K savings for a plan with a $2M annual drug spend, for example.
The Generic Substitution Rate (GSR) is the rate at which generic drugs are dispensed in place of their brand reference products. The Generic Substitution Rate (GSR) for this client (Figure 1) is 99.3%. In layman’s terms, a generic drug is dispensed in place of its brand reference product more than 99% of the time! If a PBM is managing its clinical programs efficiently, your GDR should be right at or above 90% and the GSR above 95%. A high GSR, 95% or above, is a clear indicator whether drug utilization management programs are being run efficiently or are just being rubberstamped.
Generic Substitution Rate = number of generic drug claims/sum of generic and MSB drug claims
A 2020 analysis from Avalere Health finds 52% of Part D plans achieve generic substitution rates above 75%. Put another way, 48% of Part D plans were unable to achieve generic substitution rates above 75%. This is horrifying as far as wastefulness. In a 2019 report, IQVIA Institute estimates generics make up 90% of all prescriptions but they are only a fraction of overall costs. Brand-name drugs make up the remaining 10% but account for 79% of all drug spending. An 80% GDR is not good, it is a clear-cut indicator of poor clinical management whether you care or not.
Generic Substitution Rate Conclusion
Non-fiduciary PBMs have little incentive to help plan sponsors monitor the GSR metric. Simply put, they don’t want to be deemed as fiduciaries by guiding you in the right direction and identifying problem areas. Ask your PBM’s executive sponsor, not the sales executive, are you contractually obligated to help contain our costs? 50% of PBMs will say no, 40% will be unsure, 10% will say yes but 90% of the 10% that say yes will be disingenuous. That leaves 1 out every 100 PBMs who have contractually obligated themselves to contain your costs. TransparentRx is part of the 99th percentile so click here to learn more about us.
This document is updated weekly, but why is it important? Healthcare marketers are aggressively pursuing new revenue streams to augment lower reimbursements provided under PPACA. Prescription drugs, particularly specialty, are key drivers in the growth strategies of PBMs, TPAs, and MCOs pursuant to health care reform.
How to Determine if Your Company [or Client] is Overpaying
Step #1: Obtain a price list for generic prescription drugs from your broker, TPA, ASO or PBM every month.
Step #2: In addition, request an electronic copy of all your prescription transactions (claims) for the billing cycle which coincides with the date of your price list.
Step #3: Compare approximately 10 to 20 prescription claims against the price list to confirm contract agreement. It’s impractical to verify all claims, but 10 is a sample size large enough to extract some good assumptions.
Step #4: Now take it one step further. Check what your organization has paid, for prescription drugs, against our acquisition costs then determine if a problem exists. When there is more than a 5% price differential for brand drugs or 25% (paid versus actual cost) for generic drugs we consider this a potential problem thus further investigation is warranted.
Multiple price differential discoveries mean that your organization or client is likely overpaying. REPEAT these steps once per month.
— Tip —
Always include a semi-annual market check in your PBM contract language. Market checks provide each payer the ability, during the contract, to determine if better pricing is available in the marketplace compared to what the client is currently receiving.
We use cookies to ensure that we give you the best experience on our website. If you continue to use this site we will assume that you are happy with it.AcceptPrivacy Policy