Specialty Pharmacy Spending Continues to Grow

[Click to Enlarge]

A report by Blue Cross Blue Shield (BCSBS) analyzed the growth in specialty drug costs from 2013 to 2014 through a sample size of about 70.5 million BCBS members per year. The analysis revealed a 26% increase in the annual spending of specialty pharmacy from 2013 to 2014. The increased costs of specialty drug treatments, including the price and selection of drugs, were found to be the main drivers of spending growth.

Annual specialty drug spending was found to be 17% higher per member in the individual market compared with the employer market in 2014. The main difference between these markets was the utilization rates by condition, which was higher for individual members in viral infections, cancer, and hepatitis treatments. This did not include multiple sclerosis or inflammatory conditions. The study authors said that in order for specialty drugs to remain sustainable, they must be affordable to consumers.

The report included 15 of the most expensive or common specialty drug categories, which account for more than 80% of total specialty pharmacy costs. Drugs used to treat cancer, inflammatory conditions, multiple sclerosis, hepatitis, and HIV are the 5 highest costing drug categories. The 10 other drug categories represented smaller contributions to overall expenditures and were grouped in the “other” category.

When the categories were broken down, the study revealed that about $14.6 billion was spent on specialty pharmacy drugs for the top 15 categories in 2013, about two-thirds of which treat multiple sclerosis, cancer, and inflammatory conditions. For 2014, the total spending increased 26% to $18.4 billion.

Although spending increased in each of the drug categories, hepatitis C specifically rose 612%, and as a result of the introduction of new drugs, there was a $29 annual increase per member.

– See more at: http://www.specialtypharmacytimes.com/news/specialty-pharmacy-spending-continues-to-grow#sthash.PHlD3F6s.dpuf

Reference Pricing: “Net” Invoice Cost for Top Selling Generic and Brand Prescription Drugs (Volume 120)

This document is updated weekly, but why is it important?  Healthcare marketers are aggressively pursuing new revenue streams to augment lower reimbursements provided under PPACA. Prescription drugs, particularly specialty, are key drivers in the growth strategies of PBMs, TPAs and MCOs pursuant to healthcare reform. 

The costs shared below are what the pharmacy actually pays; not AWP, MAC or WAC. The bottom line; payers must have access to “reference pricing.” Apply this knowledge to hold PBMs accountable and lower plan expenditures for stakeholders.


How to Determine if Your Company [or Client] is Overpaying


Step #1:  Obtain a price list for generic prescription drugs from your broker, TPA, ASO or PBM every month.


Step #2:  In addition, request an electronic copy of all your prescription transactions (claims) for the billing cycle which coincides with the date of your price list.

Step #3:  Compare approximately 10 to 20 prescription claims against the price list to confirm contract agreement.  It’s impractical to verify all claims, but 10 is a sample size large enough to extract some good assumptions.

Step #4:  Now take it one step further. Check what your organization has paid, for prescription drugs, against our pharmacy cost then determine if a problem exists. When there is a 5% or more price differential (paid versus actual cost) we consider this a problem.

Multiple price differential discoveries means that your organization or client is likely overpaying. REPEAT these steps once per month.

— Tip —

Always include a semi-annual market check in your PBM contract language. Market checks provide each payer the ability, during the contract, to determine if better pricing is available in the marketplace compared to what the client is currently receiving.

When better pricing is discovered the contract language should stipulate the client be indemnified. Do not allow the PBM to limit the market check language to a similar size client, benefit design and/or drug utilization. In this case, the market check language is effectually meaningless.

1 Number From CVS Health That Blew Me Away

Source: Department of Labor

After it rang up more than $153 billion in total sales last year — making it one of the largest retail operations in the world — industry watchers expect the company’s top-line to surpass $181 billion this year. That represents double-digit growth off of an enormous base, which is an impressive accomplishment for a company of CVS Health’s size.

I’ve been digging deep into CVS Health’s recent financial results and have been blown away by just how big this company has become. Below is a list of 15 numbers that amazed me and might help you put this behemoth’s size into perspective.

97.3%: This was CVS Health’s retention rate for its PBM customers last quarter. It’s a remarkably high number that demonstrates just how much its services are valued by customers.

Tyrone’s Comment:  97.3% is especially high when you consider plan sponsors can’t make heads or tails about how much they actually pay for the services. This is different from plan costs; hidden somewhere in the total spend are the legacy PBM’s service revenues (fee).

$2.1 billion: That’s how much the company spent on repurchasing its own shares during the first quarter. In total, 22.4 million shares were retired for an average price of $98.52 per share, and management has plans to buy back another $1.8 billion worth by year-end. That should ensure that the company’s share count continues to decline at a rapid rate.

$40 billion: That’s how much revenue CVS Health pulled in from its specialty drug business in 2015, which was up 32% percent over the prior year.

$5 billion: That’s how much total capital will be returned to shareholders in 2016 through a combination of dividends and buybacks. Still, the company’s cash balance is expected to grow this year, as management plans to throw off at least $5.3 billion in total cash flow for the year.

80 million: That’s about how many members are covered by CVS Health’s pharmacy benefits management (PBM) business. That’s the second-largest network in the country, behind only Express Scripts.

9,600: That’s the approximate number of pharmacies that are currently in CVS Health’s retail empire. This number took a sizable step forward last year when the company ponied up $1.9 billion to take over Target’s pharmacy and clinic business, and the company continues to grow organically, too. Management has plans to net a total of 100 new store openings during 2016.

17.5% to 19%: That’s how much total revenue growth CVS Health expects to show for the full year. Acquisition-related costs and slightly lower margins are going to curtail profit growth, but management is still guiding for adjusted earnings to fall in the range of $5.73 to $5.88. That’s growth of at least 11% versus the prior year.

23.9%: That is CVS Health’s retail pharmacy market share during the first quarter of 2016. That’s up 245 basis points versus the same quarter a year ago, mostly because of inclusion of its Target acquisition — but the company believes that it grew organically, too. That’s a healthy lead over the 19.5% market share that Walgreens Boots Alliance boasted over the same period.

85.2%: This is the percentage of dispensed drugs from its PBM business that were generics in the first quarter. It was up 170 basis points versus the same period last year, and with more drugs losing patent protection each year and the rise of biosimilars, it is likely to keep climbing.

By Brian Feroldi

Reference Pricing: “Net” Invoice Cost for Top Selling Generic and Brand Prescription Drugs (Volume 119)

This document is updated weekly, but why is it important?  Healthcare marketers are aggressively pursuing new revenue streams to augment lower reimbursements provided under PPACA. Prescription drugs, particularly specialty, are key drivers in the growth strategies of PBMs, TPAs and MCOs pursuant to healthcare reform. 

The costs shared below are what the pharmacy actually pays; not AWP, MAC or WAC. The bottom line; payers must have access to “reference pricing.” Apply this knowledge to hold PBMs accountable and lower plan expenditures for stakeholders.

How to Determine if Your Company [or Client] is Overpaying


Step #1:  Obtain a price list for generic prescription drugs from your broker, TPA, ASO or PBM every month.


Step #2:  In addition, request an electronic copy of all your prescription transactions (claims) for the billing cycle which coincides with the date of your price list.

Step #3:  Compare approximately 10 to 20 prescription claims against the price list to confirm contract agreement.  It’s impractical to verify all claims, but 10 is a sample size large enough to extract some good assumptions.

Step #4:  Now take it one step further. Check what your organization has paid, for prescription drugs, against our pharmacy cost then determine if a problem exists. When there is a 5% or more price differential (paid versus actual cost) we consider this a problem.

Multiple price differential discoveries means that your organization or client is likely overpaying. REPEAT these steps once per month.

— Tip —

Always include a semi-annual market check in your PBM contract language. Market checks provide each payer the ability, during the contract, to determine if better pricing is available in the marketplace compared to what the client is currently receiving.

When better pricing is discovered the contract language should stipulate the client be indemnified. Do not allow the PBM to limit the market check language to a similar size client, benefit design and/or drug utilization. In this case, the market check language is effectually meaningless.

High cost or high value? Specialty pharmaceuticals add to employers’ health care costs

[Click to Enlarge]

In 2015, Blue Care Network spent $55.4 million for just 712 members who each took a specialized drug to treat Hepatitis C.

That’s a staggering amount of money for such a small group of people — and it’s just one specialty medication.

The drug in question — Harvoni from Foster City, Calif.-based Gilead Sciences Inc. — can cure Hepatitis C, a communicable virus that destroys the liver. The prescription medication’s success can avoid the high cost of a liver transplant to save a patient’s life, plus the ongoing costs of anti-rejection drugs for years afterward.

The drug’s success rate and high cost pose a dilemma for health insurers and employers, who are paying the rapidly rising bill for the new generation of medications that can treat or cure complex diseases. The catch: Those specialty drugs often come with an enormous price tag.

“As outrageously expensive as some of these drugs are, we have to realize there is an economic benefit at the end of the day because of the condition that it’s treating,” said Bob Hughes, the owner and president of Advantage Benefits Group Inc. in Grand Rapids.

Hughes calls the high costs associated with specialty drugs “a tidal wave” coming at employers.


As the costs of specialty drugs continue to rise and their use grows, Hughes and others suggest that employers need to take a balanced approach in response. They should have a pharmacy benefit in place that’s designed to control costs as well as help employees who are hit with a complex or genetic-based disease to have access to specialty drugs that can treat their conditions.

In the case of Harvoni for Hepatitis C — which costs more than $1,000 per dose and must be taken for 82 days — “the opposite of not taking that drug can be a lot worse,” Hughes said.

“You have to be careful not to cut off your arm to spite yourself,” he said. “When it’s a drug that really changes a person’s life, it’s hard for the employer to make it go away.”

‘POINT OF PANIC’

The high cost of specialty drugs has been a growing trend over the last few years. However, employer awareness of the resulting cost implications depends on the type of health coverage the company uses, said Shannon Enders, a partner at Lakeshore Employee Benefits in Muskegon.

For fully insured employers that are part of a larger risk pool, “I just don’t think it’s resonating,” Enders said.

Self-funded employers have the exact opposite reaction.

“It’s resonating big time to the point of panic,” Enders said. “It’s getting tougher and tougher to take the high road and say, ‘I want to provide quality health care to my employees.’”

Employers with fully-insured health coverage typically already have measures built into their benefits packages by their insurance carriers to address the issue. Self-funded employers should make sure their pharmacy coverage does the same, Enders said.

Employers also should make sure their pharmacy benefit requires pre-authorization for a specialty drug and that it has steps built in so patients must first try a lower-cost drug that can treat their conditions, Hughes said. If it doesn’t work for them, then they can move on to the high-cost specialty drug.

Benefits packages also can require a prescription for a specialty drug to be filled only halfway the first time, such as for a 15-day supply instead of a month’s worth.

If a specialty drug doesn’t work for specific patients, or if they are unable to tolerate the side effects and need to change to another medication, then there’s less waste involved, Hughes said.

“You don’t get stuck with a bunch of expensive drugs,” he said. “Yeah, that’s jumping through a hoop, but you just can’t keep writing these blank checks forever.”

Requiring or encouraging the use of and directly contracting with specialty pharmacies can help to control costs, as can adopting a tiered drug formulary that designates “preferred” and “non-preferred” specialty drugs with escalating co-pays. Employers can also add stop-loss coverage to their pharmacy benefits.

An employer should set drug co-pays at levels that encourage the use of lower-cost options first or the use of a specialty pharmacy, Hughes said. He also advises clients to start learning about their options and educating employees about the cost implications and why they may have to pay a higher co-pay for a specialty drug.

Hughes cautions about the use of coupons from pharmaceutical companies that wave the initial drug co-pay, insulating the employee from the actual cost. That can lead to patients starting on the expensive drug because they had a coupon, never having tried a lower-cost option for their conditions because it has a co-pay, he said.

ESCALATING TREND

Research showing the high cost of specialty drugs coming to the market has been emerging the last few years.

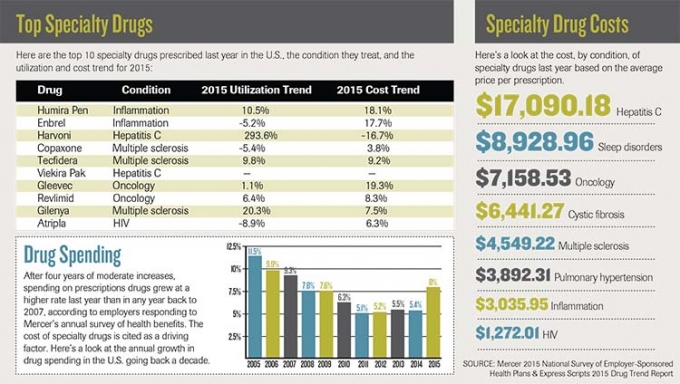
After four years of spending increases that ranged from 5.1 percent to 5.5 percent, the nearly 2,500 employers responding to Mercer’s 2015 national survey of health care coverage reported that their prescription benefit cost grew 8 percent. Half of the respondents that had the ability to break out data reported that their cost for specialty drugs grew 22 percent in 2015, according to Mercer.

Express Scripts, a St. Louis-based pharmacy benefit manager, reported in March that overall drug spending in the U.S. increased 5.2 percent in 2015. Spending on specialty drugs alone grew 17.8 percent.

Specialty drugs in 2015 accounted for 37.7 percent of all drug spending in the U.S., according to an annual trend report by Express Scripts. The company projects that to grow to 50 percent by 2018. It also noted that pharmaceutical companies presently are developing some 7,000 potential new specialty drugs, many for the high-use areas of oncology, neurologic disorders and infectious diseases.

Among the drivers for the higher spending are increased prices charged by pharmaceutical companies. Express Scripts cites an increase of more than 18.1 percent last year in the price for Humira and a 17-percent increase for Enbrel, both of which are used to treat inflammation.

Express Scripts predicts that total drug spending will increase by 6 percent to 8 percent annually between 2016 and 2018 in the U.S. Spending on specialty drug spending, led by medications to treat inflammatory conditions and new drugs to treat cancer, will increase an average of 17 percent annually over the next three years, according to the company.

A SMALL, BUT COSTLY COHORT

Quite often for insurers, the cost for specialty drugs stems from a relatively small number of people who need those prescriptions.

About 1 percent of Priority Health’s 650,000-plus members typically use a specialty drug at any given time, accounting for about 40 percent of all drug spending by the Grand Rapids-based health plan. That cost “has been creeping up” by three to four percentage points a year, said Steve Marciniak, Priority Health’s vice president of pharmacy programs.

Priority Health’s overall drug spending increased by more than 10 percent in 2015, after trending in the single digits in prior years, Marciniak said.

The cost increases for specialty drugs have forced health plans to respond. Insurers are giving heavy scrutiny to new specialty drugs coming onto the market and are evolving their business practices accordingly.

The key is assuring a specialty drug is medically necessary and appropriately prescribed for patients and their conditions.

– See more at: https://mibiz.com/item/23632-high-cost-or-high-value-specialty-drugs-add-to-employer-health-care-bill#sthash.TBPdKbUg.dpuf

Reference Pricing: “Net” Invoice Cost for Top Selling Generic and Brand Prescription Drugs (Volume 118)

This document is updated weekly, but why is it important?  Healthcare marketers are aggressively pursuing new revenue streams to augment lower reimbursements provided under PPACA. Prescription drugs, particularly specialty, are key drivers in the growth strategies of PBMs, TPAs and MCOs pursuant to healthcare reform. 

The costs shared below are what the pharmacy actually pays; not AWP, MAC or WAC. The bottom line; payers must have access to “reference pricing.” Apply this knowledge to hold PBMs accountable and lower plan expenditures for stakeholders.

How to Determine if Your Company [or Client] is Overpaying


Step #1:  Obtain a price list for generic prescription drugs from your broker, TPA, ASO or PBM every month.


Step #2:  In addition, request an electronic copy of all your prescription transactions (claims) for the billing cycle which coincides with the date of your price list.

Step #3:  Compare approximately 10 to 20 prescription claims against the price list to confirm contract agreement.  It’s impractical to verify all claims, but 10 is a sample size large enough to extract some good assumptions.

Step #4:  Now take it one step further. Check what your organization has paid, for prescription drugs, against our pharmacy cost then determine if a problem exists. When there is a 5% or more price differential (paid versus actual cost) we consider this a problem.

Multiple price differential discoveries means that your organization or client is likely overpaying. REPEAT these steps once per month.

— Tip —

Always include a semi-annual market check in your PBM contract language. Market checks provide each payer the ability, during the contract, to determine if better pricing is available in the marketplace compared to what the client is currently receiving.

When better pricing is discovered the contract language should stipulate the client be indemnified. Do not allow the PBM to limit the market check language to a similar size client, benefit design and/or drug utilization. In this case, the market check language is effectually meaningless.

U.S. Investigates Drugmaker Contracts With Pharmacy Benefit Managers

[Click to Enlarge]

Federal prosecutors are investigating drugmakers’ contracts with companies that manage prescription benefits in the U.S., the latest sign of government scrutiny of how drug companies and industry middlemen do business.

The U.S. attorney’s office for the Southern District of New York has sent demands for information to at least three drug companies: Johnson & Johnson, Merck & Co. and Endo International PLC, according to recent company filings with the U.S. Securities and Exchange Commission.

The so-called civil investigative demands seek information about the companies’ contracts with pharmacy-benefit managers, or PBMs, which administer drug benefits for employers and health insurers. The drug companies didn’t name any specific PBMs in their disclosures.


J&J said in an SEC filing on Tuesday it received a civil investigative demand in March, seeking information about contractual relationships between its Janssen Pharmaceuticals unit and PBMs since 2006, for certain Janssen products.

J&J said the demand was issued in connection with an investigation under the False Claims Act, a federal law that prohibits people and companies from defrauding the federal government.

Merck said in an SEC filing on Monday it received a civil investigative demand for information about its “contracts with, services from and payments to pharmacy-benefit managers” since 2006, in connection with the products Maxalt and Levitra.

Maxalt is a treatment for migraines and Levitra treats erectile dysfunction. The company said it is cooperating with the investigation. A Merck spokeswoman declined immediate comment.

Endo said in an SEC filing last week it received a demand for documents and information about contracts with PBMs for the migraine drug Frova. The company said it is cooperating with the investigation. An Endo spokeswoman said the company doesn’t yet have additional details on the investigation.

A spokesman for the U.S. attorney’s office in New York declined to comment. A civil investigative demand is a government tool to request information that is sometimes broader in scope than a subpoena for documents.

The disclosures of the civil investigative demands don’t identify any benefit manager by name. An Express Scripts Holding Co. spokesman declined comment and a CVS Health Corp. spokesman said the company has “not received a similar inquiry from this U.S. Attorney’s office.”

It is common for drug companies to agree to pay rebates or offer other forms of discounts to PBMs in exchange for these managers agreeing to pay for their members’ use of certain drugs.

By Peter Loftus

Reference Pricing: “Net” Invoice Cost for Top Selling Generic and Brand Prescription Drugs (Volume 117)

This document is updated weekly, but why is it important?  Healthcare marketers are aggressively pursuing new revenue streams to augment lower reimbursements provided under PPACA. Prescription drugs, particularly specialty, are key drivers in the growth strategies of PBMs, TPAs and MCOs pursuant to healthcare reform. 

The costs shared below are what the pharmacy actually pays; not AWP, MAC or WAC. The bottom line; payers must have access to “reference pricing.” Apply this knowledge to hold PBMs accountable and lower plan expenditures for stakeholders.

How to Determine if Your Company [or Client] is Overpaying


Step #1:  Obtain a price list for generic prescription drugs from your broker, TPA, ASO or PBM every month.

Step #2:  In addition, request an electronic copy of all your prescription transactions (claims) for the billing cycle which coincides with the date of your price list.

Step #3:  Compare approximately 10 to 20 prescription claims against the price list to confirm contract agreement.  It’s impractical to verify all claims, but 10 is a sample size large enough to extract some good assumptions.

Step #4:  Now take it one step further. Check what your organization has paid, for prescription drugs, against our pharmacy cost then determine if a problem exists. When there is a 5% or more price differential (paid versus actual cost) we consider this a problem.

Multiple price differential discoveries means that your organization or client is likely overpaying. REPEAT these steps once per month.

— Tip —

Always include a semi-annual market check in your PBM contract language. Market checks provide each payer the ability, during the contract, to determine if better pricing is available in the marketplace compared to what the client is currently receiving.

When better pricing is discovered the contract language should stipulate the client be indemnified. Do not allow the PBM to limit the market check language to a similar size client, benefit design and/or drug utilization. In this case, the market check language is effectually meaningless.

High-cost specialty drugs; predictions for the future

[Click to Enlarge]

Doug Long, vice president, industry relations for IMS Health, kicked off Thursday morning, April 21, at the Academy of Managed Care & Specialty Pharmacy Annual Meeting 2016, with his presentation on marketplace trends, “Charting the Course for Change: Industry Update.”

The news is not good: U.S. spending on drugs increased 12.2% to $424.8 billion in 2015, spiking 46 billion over the past year due to higher brand spending and fewer patent expirations; however, spending on brands without exclusivity reduced growth by $14.2 billion in 2015.

On the positive side, net price growth slowed in 2015 to 2.8% as concessions from manufacturers rose sharply. Other metrics from 2015 include: Brands accounted for 11% of prescriptions but drove 73% of sales; prescriptions rose 1% in the last 12 months; diabetes, autoimmune diseases, hepatitis and oncology led the spending growth; specialty new brands continued to spur growth (up 21.5%); and Abilify, Celebrex and Nexium lost patent protection.

Long looked back at 2015 and pointed out the most notable events, which included exclusive launches and price wars for hepatitis C, the arrival of the first biosimilar, Zarxio, and of generic Nexium, rescheduling of controlled substances, the unforgettable price gouging by Valeant and Turing, and merger mania extending into 2016.

As far as specialty goes, 2015 brought more innovation to hepatitis C, along with the emergence of PD1s, PCSK9 inhibitors, orphan drugs, generic Copaxone and more orals, more copayment program cooperation by payers, the patient as payer and more value-driven metrics.

Long predicted that 2016 will continue along the same path with another biosimilar approved, a CMS ruling on Part B reimbursement, a new hepatitis entrant from Merck, new FDA/DEA guidelines on controlled substances, price discussions on orphan drugs and gene therapies and a more-crowded specialty space.

Long said that total prescriptions at chains are expected to far exceed market growth, while mail-order, long-term care and independent pharmacies are going to continue to decline through 2020, at which time, chains could consume a 45.8% share of the market.

By Mari Edlin