New study claims hospitals charge double for specialty drugs compared to pharmacies [Weekly Roundup]
News and notes from around the interweb:
- Justice Department Sues to Block UnitedHealth Group’s Acquisition of Change Healthcare. The Department of Justice, together with Attorneys General in Minnesota and New York, filed a civil lawsuit to stop UnitedHealth Group Incorporated (United) from acquiring Change Healthcare Inc. (Change). The complaint, filed in the U.S. District Court for the District of Columbia, alleges that the proposed $13 billion transaction would harm competition in commercial health insurance markets, as well as in the market for a vital technology used by health insurers to process health insurance claims and reduce health care costs.
- AHIP study claims hospitals charge double for specialty drugs compared to pharmacies. Hospitals on average charge double the price for the same drugs compared to those offered by specialty pharmacies, according to a new insurer-funded study released as federal regulators ponder a probe into the pharmacy benefit management industry. The study (PDF), released Wednesday by insurance lobbying group AHIP, comes as specialty pharmacies have grown in use among PBMs and payers to dispense specialty products. The study was released a day before a scheduled meeting Thursday of the Federal Trade Commission on whether to probe the competitive impact of PBM contracts and how they could disadvantage independent and specialty pharmacies.
-
Join the Movement! How to better manage your specialty drug costs. To help reduce their drug costs, plan sponsors are turning to new tools such as specialty drug cost management services which enable their members/employees to gain access to alternative forms of funding. The best of these services uses an advocacy model that procures alternatives for hundreds of high-cost drugs used to treat chronic conditions. Not only do these services reduce the cost of the drugs to a plan, but they also lower and/or limit the plan’s liability for stop loss coverage.
- Over 800 Prescription Medications Got More Expensive in January 2022. The list prices for 810 prescription drugs increased by an average of 5.1 percent between Dec. 29 and Jan. 31, according to a GoodRx report released Feb. 4. Of the 810 medications that saw price increases in January, 791 were brand drugs, 19 were generics, 199 were specialty drugs and 84 were healthcare practitioner-administered drugs. The 791 brand drugs’ prices increased by an average of 4.9 percent, and the 19 generic drugs’ prices increased by an average of 12.6 percent. Price hikes in January 2022 were on par with January 2021, which saw 832 price hikes. In January 2022, drug prices rose by an average of 5.1 percent, half a percentage greater than in January 2021. The price hikes came from 155 drugmakers.
- New Exposé Reveals Pharmacy Benefit Manager Tactics That Hurt Patients, Providers, Employers, and Taxpayers. The report, “Pharmacy Benefit Manager Exposé: How PBMs Adversely Impact Cancer Care While Profiting at the Expense of Patients, Providers, Employers, and Taxpayers,” was commissioned by the Community Oncology Alliance (COA) and written by industry experts at the law firm of Frier Levitt, LLC. It provides a comprehensive exposé and legal analysis of the most pervasive and abusive PBM tactics, highlighting the adverse impact they have on patients, providers, and health care payers (including Medicare, Medicaid, employers, and taxpayers). The goal is for the report to serve as an authoritative reference for policymakers, regulators, employers, and others seeking greater understanding of PBM behavior while also suggesting solutions to reshape the health care industry for the better.
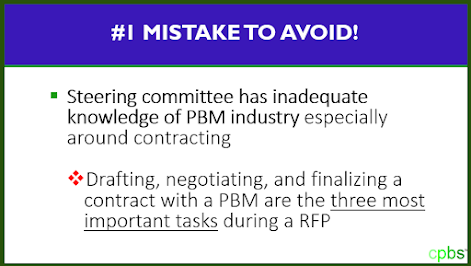
The Certified Pharmacy Benefits Specialist (CPBS) educational offering includes knowledge that is critical to effective management of the pharmacy and medical drug benefit. If you want to learn more, click here.