As Specialty Injectable Drug Sales Grow, Drug-Device Collaborations change the Competitive Landscape

As the underlying structure of their markets continues to change, injectable drug developers are relying increasingly on supply chain partners to address the evolving expectations of patients and their caregivers. In this environment, it is not unusual for drug product managers to include vendor device design engineers on their top level development teams and to hire human factors specialists to manage device concept ergonomic requirements.


While the injectable device ecosystem continues to expand, particularly in the areas of specialty design services and filling/finishing/packaging, device manufacturing is still concentrated in a small number of suppliers who have established the infrastructure, technology and track record to meet the go-to-market needs of drug developers targeting chronic indications.

For glass prefillable syringes (PFS), this list includes Becton Dickinson (BD), which continues to enjoy a significant global leadership position, German companies Gerresheimer and Schott, and a half-dozen smaller competitors.

For plastic PFS, Hospira dominates in devices for emergency medicine, while West Pharmaceutical and its Japanese partner Daikyo Seiko, Gerresheimer and its Japanese Partner Taisei Kako, and Schott all offer sophisticated devices based on COP or CCP polymers.

Prefillable safety syringes, perhaps the most highly watched market segment, are beginning to gain traction as Unilife, the former Australian company now based in the U.S., continues to sign partners and to ship product to Sanofi, its flagship customer for the Unifill prefillable safety syringe.

Once dominated by specialty device firms, the pen injector landscape is now divided between third-party device suppliers and drug developers that have brought pen manufacturing in-house.

Two-thirds of pen devices are still supplied by a handful of specialist design/manufacture firms, including Ypsomed which supplies pens and specialty injectors to more than a dozen pharmaceutical companies. But as this market continues to shift away from third-party manufacturers, Ypsomed is striving to change its business model to offset customer losses.

Autoinjectors, the fastest growing device segment, is highly competitive, led by a group of suppliers that include SHL Medical, Ypsomed, Owen Munford, Gerresheimer, BD and Haselmeier. Autoinjector growth will be particularly high for new specialty injectables that traditionally have been marketed in pen injectors.

Needle-free injectors (NFI) have struggled to compete effectively against the growing tide of user-friendly injection devices. Recent results for prefilled NFI products have been encouraging. But beyond niche markets, this segment continues to underachieve.

The market for point-of-care reconstitution devices is moving beyond niche markets as protein drugs for chronic diseases increase in number and share. Dual chamber cartridges and integrated dual chamber injection devices lead the way in this category. Germany’s Vetter is the clear leader in this segment, which will experience strong growth over the next three years.

A new class of injection devices, patch pumps (also known as wearable injectors), is finding success in a select few chronic disease applications, most notably insulin-dependent diabetes. This market will, however, find it challenging to maintain growth as formulation improvements, particularly in the area of sustained released, reduce dosing frequency and thus obviate a major benefit of wearable devices.

These conclusions are taken from a recent survey conducted by Applied Data Analytics. The survey’s findings can be found in a new and comprehensive report: Global Syringe & Injector Analysis and Assessment. (http://applieddata.org/Pharmaceutical_Biotech_Industry_Re…) This global report contains highly detailed data and knowledge on device designs, combination products, supplier relationships, market share information and data forecasts.

For more information, please visit:

http://applieddata.org/Pharmaceutical_Biotech_Industry_Reports.htm

About Applied Data Analytics

Applied Data Analytics assists life science management decision makers by providing analysis services and products that can reveal key relationships, patterns and trends affecting their businesses. These information tools encourage opportunity and risk discovery by promoting comprehensive, timely, and insightful analysis, allowing managers to make informed tactical and strategic decisions.

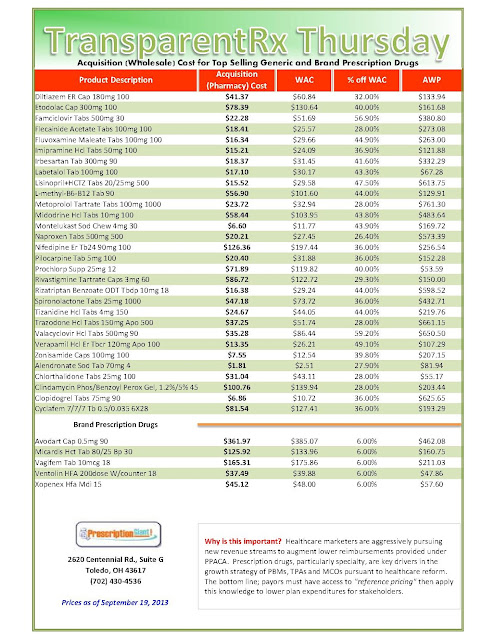
TransparentRx Thursday: Acquisition (Pharmacy) Cost for Top Selling Generic and Brand Prescription Drugs

Why is this document important?  Healthcare marketers are aggressively pursuing new revenue streams to augment lower reimbursements provided under PPACA. Prescription drugs, particularly specialty, are key drivers in the growth strategies of PBMs, TPAs and MCOs pursuant to healthcare reform. The bottom line; payers must have access to “reference pricing” then apply this knowledge to lower plan expenditures for stakeholders.

As of 9/26/2013 – Published Weekly on Thursdays
How to Determine if a Pricing Problem Exists


Step #1:  Obtain a price list for generic prescription drugs from your broker, TPA, ASO or PBM every month.

Step #2:  In addition, request an electronic copy of all your prescription transactions (claims) for the billing cycle which coincides with the date of your price list.

Step #3:  Compare approximately 10 to 20 prescription claims against the price list to confirm contract agreement.  It’s impractical to verify all claims, but 10 is a sample size large enough to extract some good assumptions.

Step #4:  Now take it one step further. Check what your organization has paid, for prescription drugs, against our pharmacy cost then determine if a problem exists. When there is a 10% or more price differential (paid versus actual cost) we consider this a problem.

 
Multiple price differential discoveries means that your organization or client is likely overpaying. REPEAT these steps once per month.

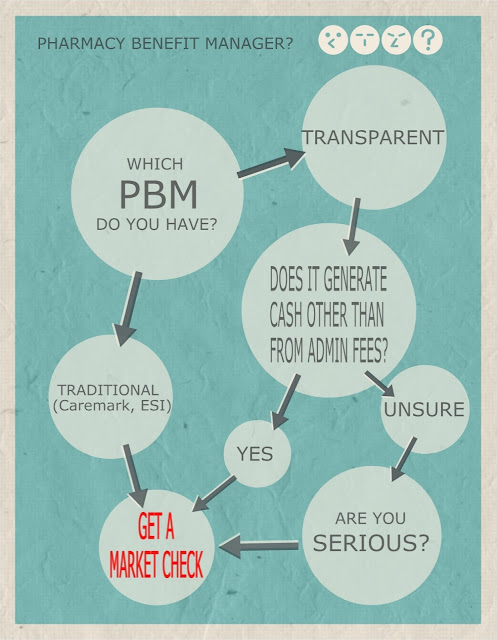
Include a semi-annual market check in your PBM contract language. Market checks provide each payer the ability, during the contract, to see if better pricing is available in the marketplace compared to what the client is currently receiving. 

When better pricing is discovered the contract language should stipulate the client be indemnified. Do not allow the PBM to limit the market check language to a similar size client, benefit design and/or drug utilization.  In this case, the market check language is effectually meaningless.

Fewer Employers Plan to Offer Retiree Prescription Drug Plans

The percentage of employers that plan to continue offering prescription drug plans to Medicare-eligible retirees has dropped dramatically in the past two years, according to a study released May 29 by Buck Consultants L.L.C.
Fifty-five percent of employers that now provide pharmacy benefits for Medicare-eligible retirees said they plan to continue offering the benefit, down from 75 percent in the New York-based consulting firm’s 2011 survey.
Another 33 percent of employers said they were unsure if they would continue offering prescription benefits to Medicare retirees after 2014, a significant increase from the 19 percent who were unsure in the 2011 survey.
“Employers have options for controlling prescription drug costs for Medicare-eligible participants,” Paul Burns, an Atlanta-based principal at Buck Consultants, said in a statement.
“For example, since retiree drug subsidy payments are no longer tax-exempt and do not keep pace with rising drug costs, some employers are considering moving to an employer group waiver plan to take advantage of additional subsidies available as a result of the Patient Protection and Affordable Care Act,” he said.

Courtesy of Forbes.com

The subsidiary of Norwalk, Conn.-based Xerox Corp. surveyed 250 human resource and benefit managers across a range of industries and employer sizes, from less than 2,000 full-time workers to more than 20,000.

Active employees
On the whole, 99 percent of employers surveyed provide pharmacy benefits for active employees, a three-percentage-point increase from 2011, while 48 percent offer prescription coverage for Medicare-eligible retirees, according to the study.
Among employers covering retirees older than 65, the study indicated 45 percent used the Centers for Medicare and Medicaid Services’ retiree drug subsidy to offset plan costs, a decrease of five percentage points from the 2011 survey.
That decrease should not come as much of a surprise, the study noted. The healthcare reform law ended tax exemptions for CMS’ retiree drug subsidies beginning this year, and the subsidies themselves no longer keep pace with annual growth of pharmaceutical costs.
According to Buck’s study, nearly three-quarters of employers spend 16 percent or more of their total healthcare budget on pharmacy benefits.
“If not managed effectively, prescription drugs can represent a constant financial drain on company resources and undermine the return on investment of a plan sponsor’s entire healthcare benefits program,” Mr. Burns said in the statement.
Looking ahead, only 43 percent of employers said they plan to retain their current pharmacy benefit plan for retirees older than 65 after 2014. Another 31 percent said they were not sure if they will alter their plans.
The study also noted a steady rise in the percentage of employers turning to third-party pharmacy benefit managers in search of better prices, as well as plan administration and claims management services. Sixty-one percent of employers polled in this year’s survey indicated they contract with a PBM, compared with 57 percent in 2011 and 47 percent in 2009.
“With many medications having double-digit price increases and with the continued consolidation among PBMs, this is a buyer’s market for PBM pricing,” Mr. Burns said, noting that employers should not be shy about taking an “aggressive” stance in negotiations with potential PBMs. “Any PBM contract that is 18-24 months old should be reviewed for pricing competitiveness as well as up-to-date contractual language.”
Contraceptives
Buck also surveyed employers’ positions on compliance with certain pharmacy-related provisions of the Affordable Care Act, specifically the controversial rule requiring most employers and/or their insurers to provide cost-free contraceptive prescriptions and other preventive care benefits. Small employers with fewer than 50 full-time workers that do not offer employee health benefits—as well as certain types of religious employers—are exempt from the contraceptive coverage requirements.
According to Buck’s study, one-quarter of employers polled said they plan to provide no-cost coverage for name-brand and generic contraceptive prescriptions, while another 25 percent said they would only waive co-payments for name-brand contraceptives when they are deemed medically necessary versus generic equivalents.
Twenty-seven percent of employers said they plan to waive co-payments for generic and name-brand contraceptives without a generic equivalent. Eighteen percent of employers indicated they planned to take some other approach to complying with the coverage requirement, while 5 percent said they were unsure how they would proceed, according to the 2013 Prescription Drug Benefit Survey.
This report appeared in Business Insurance magazine, a Chicago-based sister publication of Tire Business.
By Matt Dunning, Crain News Service

TransparentRx Thursday: Acquisition (Pharmacy) Cost for Top Selling Generic and Brand Prescription Drugs

Why is this document important?  Healthcare marketers are aggressively pursuing new revenue streams to augment lower reimbursements provided under PPACA. Prescription drugs, particularly specialty, are key drivers in the growth strategies of PBMs, TPAs and MCOs pursuant to healthcare reform. The bottom line; payers must have access to “reference pricing” then apply this knowledge to lower plan expenditures for stakeholders.

As of 9/19/2013 – Published Weekly on Thursdays

How to Determine if a Pricing Problem Exists


Step #1:  Obtain a price list for generic prescription drugs from your broker, TPA, ASO or PBM every month.

Step #2:  In addition, request an electronic copy of all your prescription transactions (claims) for the billing cycle which coincides with the date of your price list.

Step #3:  Compare approximately 10 to 20 prescription claims against the price list to confirm contract agreement.  It’s impractical to verify all claims, but 10 is a sample size large enough to extract some good assumptions.

Step #4:  Now take it one step further. Check what your organization has paid, for prescription drugs, against our pharmacy cost then determine if a problem exists. When there is a 10% or more price differential (paid versus actual cost) we consider this a problem.

 
If you discover multiple price differentials then your organization or client is likely overpaying. REPEAT these steps once per month.

Include a semi-annual market check in your PBM contract language. Market checks provide each payer the ability, during the contract, to see if better pricing is available in the marketplace compared to what the client is currently receiving. 

When better pricing is discovered the contract language should stipulate the client be indemnified. Do not allow the PBM to limit the market check language to a similar size client, benefit design and/or drug utilization.

Employers Unhappy with Their Brokers

Many brokers might want to change the way they do business. A majority of employers are not happy with the service they provide, according to a new Zywave white paper.
What employers are looking for from their broker is changing more than ever, explains Dave O’Brien, division president of insurance solutions at the Milwaukee, Wisc.-based company. The annual “Broker Services Survey” asked more than 5,500 employers in a range of industries what they would be looking for if they were to consider changing their broker.
In the past, the ability to negotiate a lower premium always ranked highest. Last year, 61% of employers said that was highly important — that number dropped to 27% this year.

“Brokers focus on price, price, price, but the top reasons employers left their broker was because they did not provide the level of service expected, did not keep them abreast of regulatory and legal issues, and did not properly manage insurance options,” O’Brien says.

Further, Zywave says, as employers demand more service from their brokers, what brokers are actually delivering has decreased, from the employer’s point of view. Employers want to hear from their broker monthly in light of all the change going on in the industry.

In the survey, 97% of employers say providing updates on health care reform and other legislation is important, but 23% are unsatisfied with their broker’s current way of providing information.

O’Brien explains a broker likes to tell a story when prospecting. “You will see the broker go in and talk about their years in the industry and history,” he says. “Employers are saying that is not all that important. What is really important to them [is] … updates on health care reform and employee communication.”
Other survey results include:
  • 91% of employers say it is important that their broker create a strategic plan to align with company goals — but 43% are unsatisfied with their current broker
  •  95% say offering employee benefits and consumerism communications is important — but 41% are unsatisfied with their current broker
Some ways for brokers to change their story include turning to technology products, of which Zywave is a provider. O’Brien says you can’t meet all the new demands the old-fashioned way, and technology is becoming “more of a must have than a great have.”
Further, brokers need to do more than say they provide great service — they need to provide examples of it. “Imagine if five brokers walk in and say, ‘It’s our people and our service.’ You have to do more to distinguish that and define what service means,” O’Brien says. “How are you going to distinguish? Do you spent a lot of money [on training] making great people?”
The broker/employer relationship needs to be powered by performance and results. “When you talk about service, you have to defend what does that mean and how are you going to do it?” he says. “Give examples of things clients have received in the past. Tell them what you do, show them and tell them again.”
The survey was conducted during April to May and had 5,536 respondents, of which 33.4% were HR professionals, 15.3% C-suite and 8.7% benefits professionals. Of the employers who responded, 55% have 100 lives or less, 20% 100-249 lives and the rest 250 lives plus.

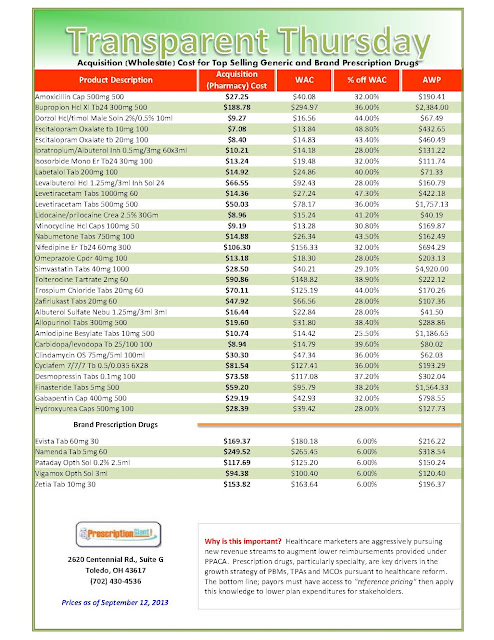
TransparentRx Thursday: Acquisition (Pharmacy) Cost for Top Selling Generic and Brand Prescription Drugs

Why is this document important?  Healthcare marketers are aggressively pursuing new revenue streams to augment lower reimbursements provided under PPACA. Prescription drugs, particularly specialty, are key drivers in the growth strategies of PBMs, TPAs and MCOs pursuant to healthcare reform. The bottom line; payers must have access to “reference pricing” then apply this knowledge to lower plan expenditures for stakeholders.

As of 9/12/2013 – Published Weekly on Thursdays

How to Determine if a Pricing Problem Exists


Step #1:  Obtain a price list for generic prescription drugs from your broker, TPA, ASO or PBM every month.

Step #2:  In addition, request an electronic copy of all your prescription transactions (claims) for the billing cycle which coincides with the date of your price list.

Step #3:  Compare approximately 10 to 20 prescription claims against the price list to confirm contract agreement.  It’s impractical to verify all claims, but 10 is a sample size large enough to extract some good assumptions.

Step #4:  Now take it one step further. Check what your organization has paid, for prescription drugs, against our pharmacy cost then determine if a problem exists. When there is a 10% or more price differential (paid versus actual cost) we consider this a problem.

 
If you discover multiple price differentials then your organization or client is likely overpaying. REPEAT these steps once per month.