_1.jpg)
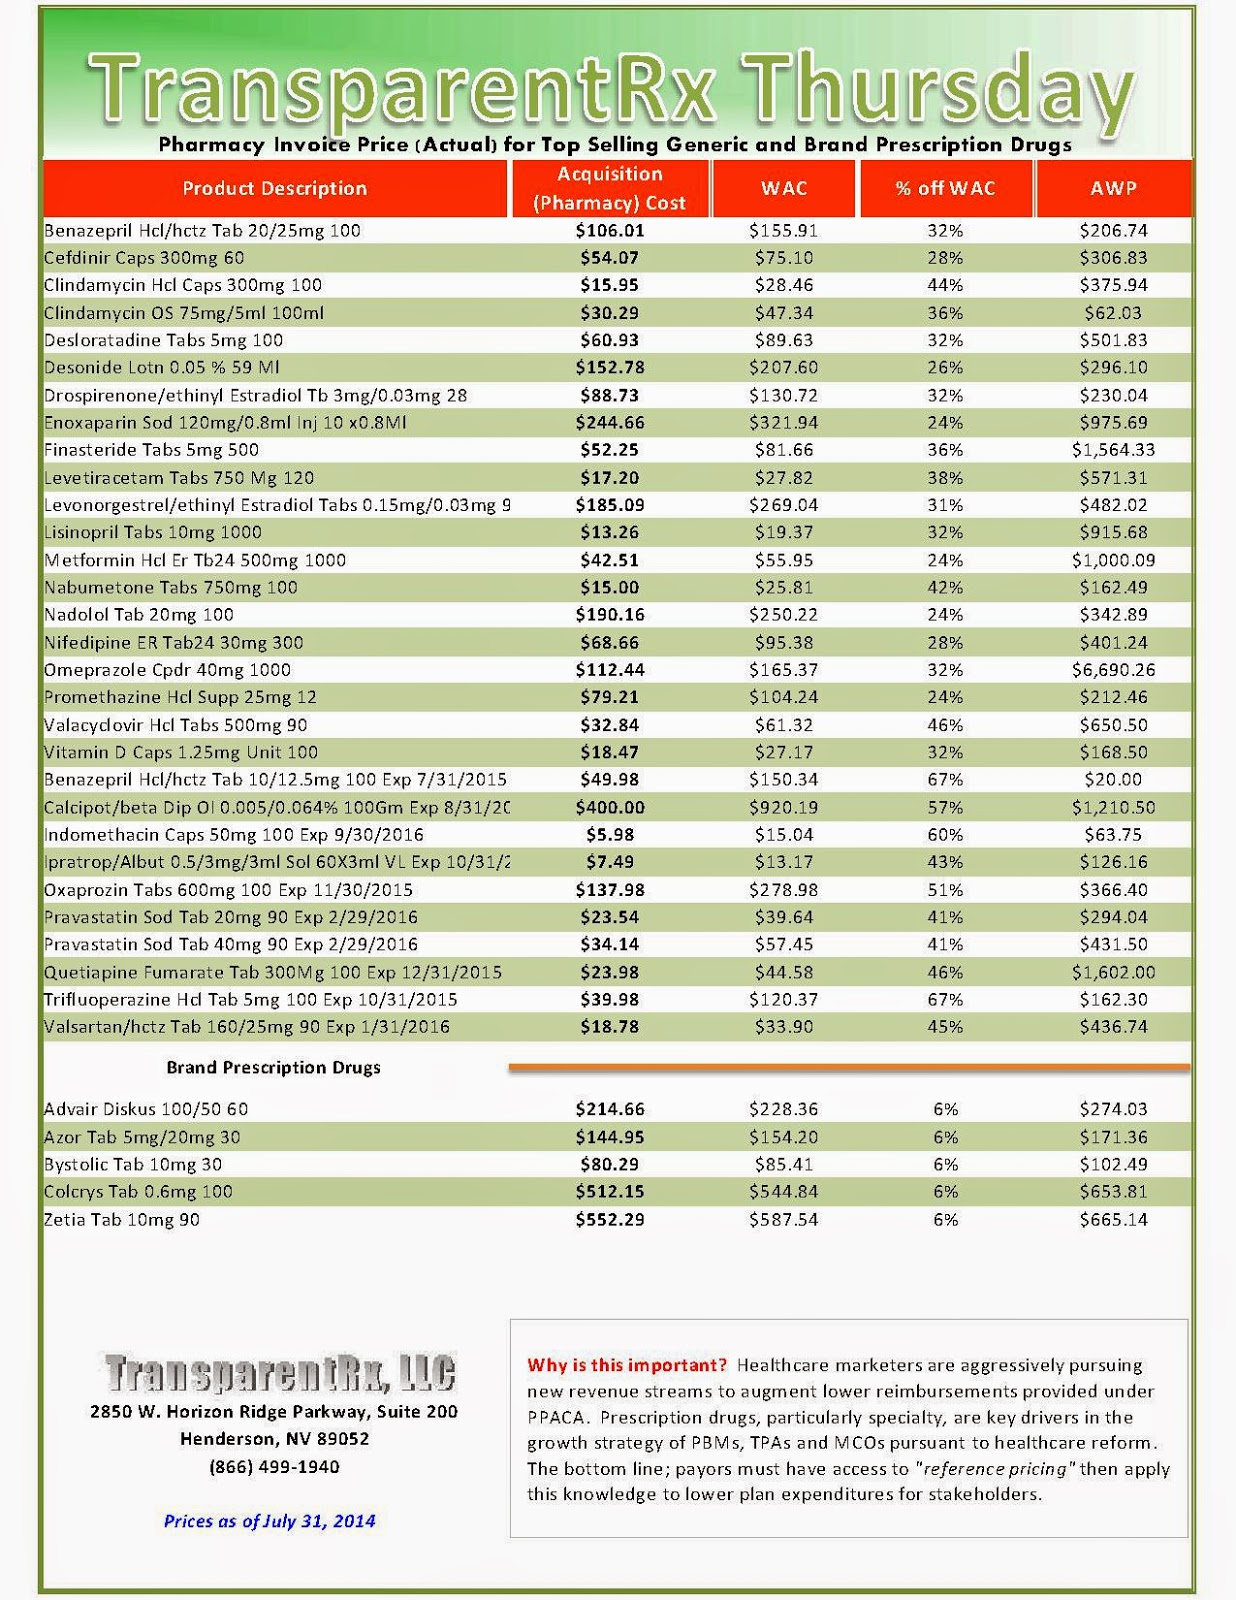
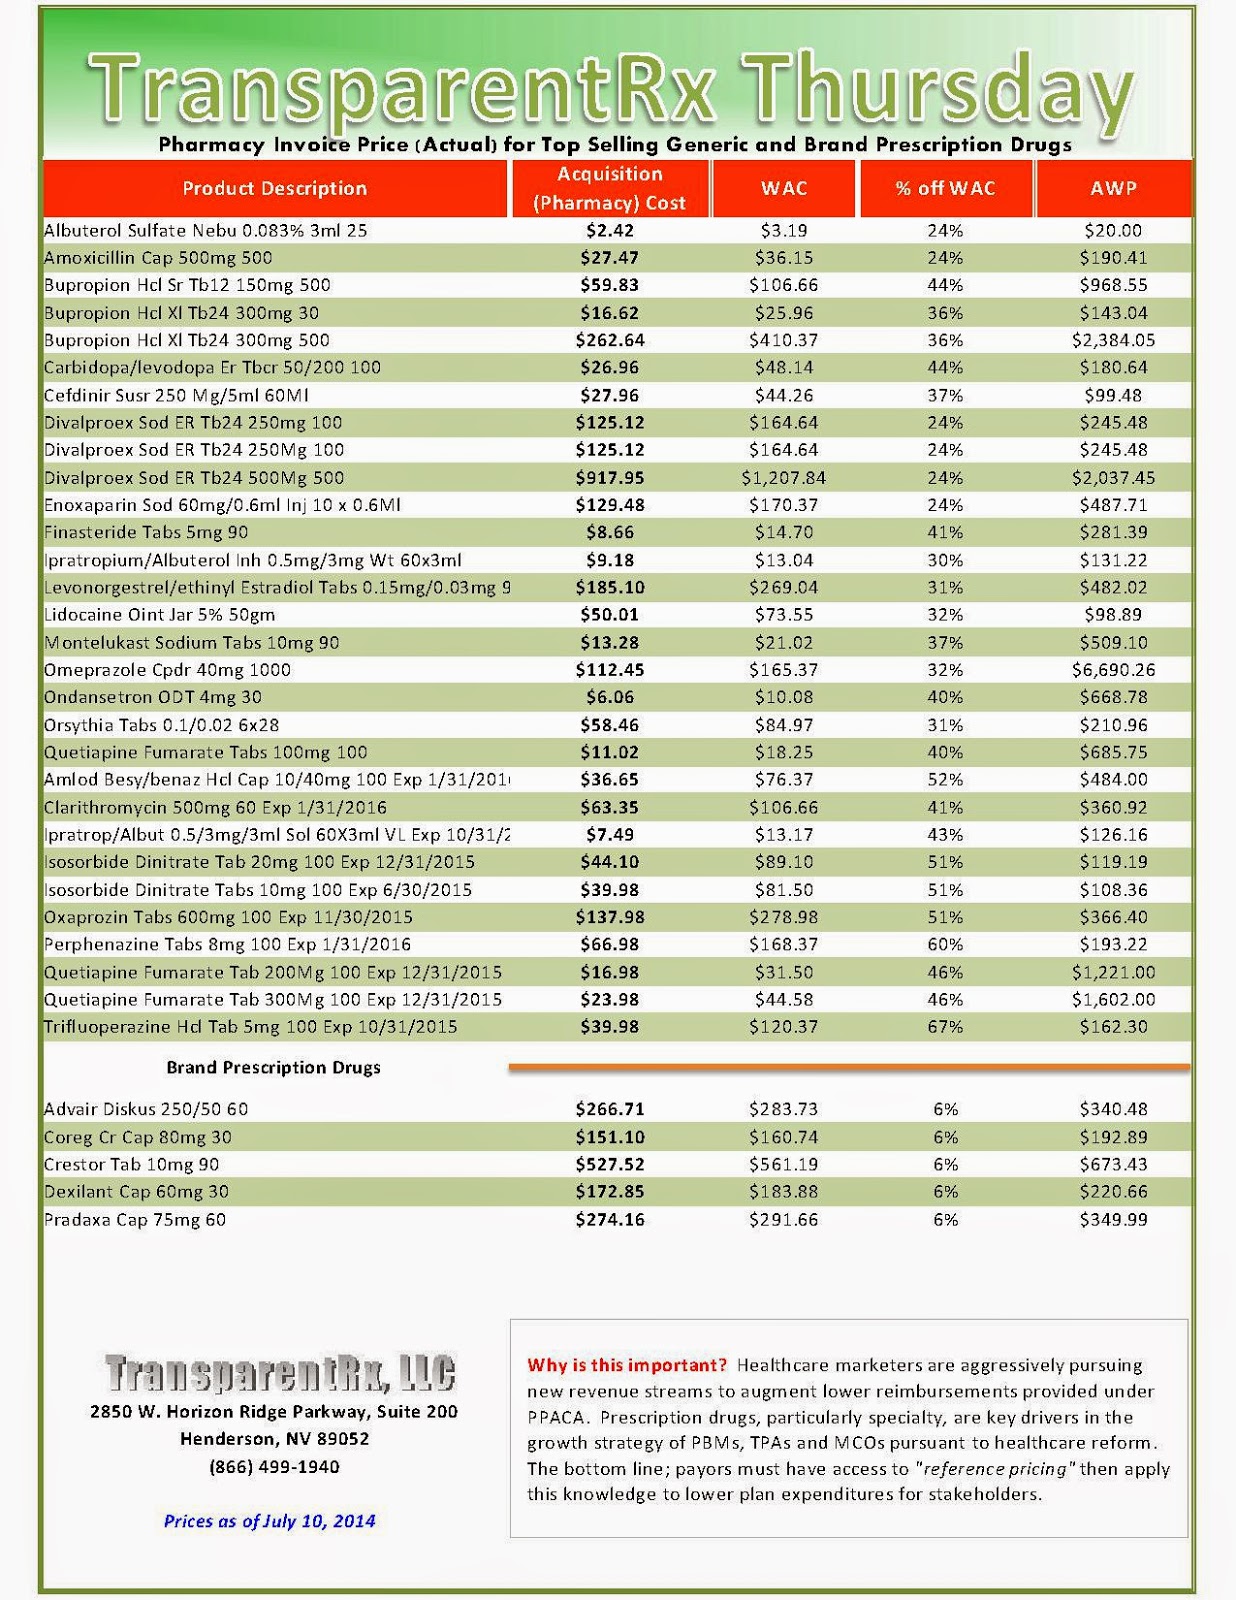
Reference Pricing: Pharmacy Invoice Cost (ACTUAL) for Top Selling Generic and Brand Prescription Drugs
Why is this document important? Healthcare marketers are aggressively pursuing new revenue streams to augment lower reimbursements provided under PPACA. Prescription drugs, particularly specialty, are key drivers in the growth strategies of PBMs, TPAs and MCOs pursuant to healthcare reform.
The costs shared below are what our pharmacy actually pays; not AWP, MAC or WAC. The bottom line; payers must have access to “reference pricing.” Apply this knowledge to hold PBMs accountable and lower plan expenditures for stakeholders.
_1.jpg)
When better pricing is discovered the contract language should stipulate the client be indemnified. Do not allow the PBM to limit the market check language to a similar size client, benefit design and/or drug utilization. In this case, the market check language is effectually meaningless.
The costs shared below are what our pharmacy actually pays; not AWP, MAC or WAC. The bottom line; payers must have access to “reference pricing.” Apply this knowledge to hold PBMs accountable and lower plan expenditures for stakeholders.
| How to Determine if Your Company [or Client] is Overpaying |
Step #1: Obtain a price list for generic prescription drugs from your broker, TPA, ASO or PBM every month.
Step #2: In addition, request an electronic copy of all your prescription transactions (claims) for the billing cycle which coincides with the date of your price list.
Step #3: Compare approximately 10 to 20 prescription claims against the price list to confirm contract agreement. It’s impractical to verify all claims, but 10 is a sample size large enough to extract some good assumptions.
Step #4: Now take it one step further. Check what your organization has paid, for prescription drugs, against our pharmacy cost then determine if a problem exists. When there is a 5% or more price differential (paid versus actual cost) we consider this a problem.
Multiple price differential discoveries means that your organization or client is likely overpaying. REPEAT these steps once per month.
— Tip —
Always include a semi-annual market check in your PBM contract language. Market checks provide each payer the ability, during the contract, to determine if better pricing is available in the marketplace compared to what the client is currently receiving.
When better pricing is discovered the contract language should stipulate the client be indemnified. Do not allow the PBM to limit the market check language to a similar size client, benefit design and/or drug utilization. In this case, the market check language is effectually meaningless.
Click here to register for: “How To Slash the Cost of Your PBM Service, up to 50%, Without Changing Providers or Employee Benefit Levels.”
Insurance Industry, Consumers Join Forces to Fight High Prices of Specialty Drugs
Here’s the next salvo in the back and forth between insurers and the drug industry over drug prices: the Pharmaceutical Research and Manufacturers of America are pushing the Department of Health and Human Services to take action to protect consumers who have gained insurance via the health law’s online marketplaces from high, out-of-pocket costs for specialty drugs.
Specialty drugs are most often prescribed for complex, chronic and often costly health conditions like rheumatoid arthritis and hepatitis C that require continuous monitoring by a health care provider.
At a June 11 press event, PhRMA, the drug industry’s trade association, and five patient advocacy groups, ranging from the Colon Cancer Alliance to the Immune Deficiency Foundation, pointed to an analysis by the consulting firm Avalere Health — commissioned by PhRMA — as reason for worry regarding these medicines.
|
Avalere Study Did Not Include Medicare Part D Drug Plans; May Impact Costs
The analysis by Avalere Health found that the vast majority of plans in the Health Insurance Exchanges require relatively high cost sharing for all medicines in at least one class. The study did not include Medicare Part D plans but did include Medicaid managed care plans.
But, can increase costs in Medicare, says the Campaign for Sustainable Rx Pricing:
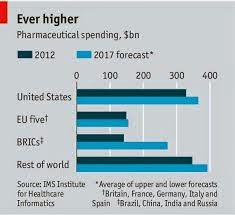
“The issue of higher cost drugs, especially “specialty drugs”, is only going to become more critical to deal with in the coming years. One estimate notes that by 2020, spending on specialty drugs will quadruple from $87 billion to more than $400 billion. This continued growth in spending will put significant upward pressure on premiums in the private marketplace as well as in public programs like Medicare.”
|
The Avalere study examined 123 formularies from silver-level exchange plans — the benchmark plan that will generally pay 70 percent of covered medical expenses, leaving the consumer responsible for 30 percent – and found that a fifth of them required cost sharing of 40 percent or more for certain classes of specialty drugs used to treat HIV/AIDS, multiple sclerosis, bipolar disorder, cancer and other illnesses.
Avalere also concluded that 60 percent of silver plan formularies placed all medications for multiple sclerosis, Crohn’s disease, cancer and other illnesses in the plan’s highest formulary tier. That means patients who need these medicines would face the highest coinsurance percentage.
PhRMA President John Castellani called on HHS to limit insurers’ ability to structure drug coverage in a way that subjects patients with these types of chronic and severe illnesses from these type of high out-of-pocket costs. To continue reading click here.
By Lisa Gillespie, Kaiser Health News
Click here to register for: “How To Slash the Cost of Your PBM Service, up to 50%, Without Changing Providers or Employee Benefit Levels.”
Reference Pricing: Pharmacy Invoice Cost (ACTUAL) for Top Selling Generic and Brand Prescription Drugs
Why is this document important? Healthcare marketers are aggressively pursuing new revenue streams to augment lower reimbursements provided under PPACA. Prescription drugs, particularly specialty, are key drivers in the growth strategies of PBMs, TPAs and MCOs pursuant to healthcare reform.
The costs shared below are what our pharmacy actually pays; not AWP, MAC or WAC. The bottom line; payers must have access to “reference pricing.” Apply this knowledge to hold PBMs accountable and lower plan expenditures for stakeholders.
_1.jpg)
When better pricing is discovered the contract language should stipulate the client be indemnified. Do not allow the PBM to limit the market check language to a similar size client, benefit design and/or drug utilization. In this case, the market check language is effectually meaningless.
The costs shared below are what our pharmacy actually pays; not AWP, MAC or WAC. The bottom line; payers must have access to “reference pricing.” Apply this knowledge to hold PBMs accountable and lower plan expenditures for stakeholders.
| How to Determine if Your Company [or Client] is Overpaying |
Step #1: Obtain a price list for generic prescription drugs from your broker, TPA, ASO or PBM every month.
Step #2: In addition, request an electronic copy of all your prescription transactions (claims) for the billing cycle which coincides with the date of your price list.
Step #3: Compare approximately 10 to 20 prescription claims against the price list to confirm contract agreement. It’s impractical to verify all claims, but 10 is a sample size large enough to extract some good assumptions.
Step #4: Now take it one step further. Check what your organization has paid, for prescription drugs, against our pharmacy cost then determine if a problem exists. When there is a 5% or more price differential (paid versus actual cost) we consider this a problem.
Multiple price differential discoveries means that your organization or client is likely overpaying. REPEAT these steps once per month.
— Tip —
Always include a semi-annual market check in your PBM contract language. Market checks provide each payer the ability, during the contract, to determine if better pricing is available in the marketplace compared to what the client is currently receiving.
When better pricing is discovered the contract language should stipulate the client be indemnified. Do not allow the PBM to limit the market check language to a similar size client, benefit design and/or drug utilization. In this case, the market check language is effectually meaningless.
Click here to register for: “How To Slash the Cost of Your PBM Service, up to 50%, Without Changing Providers or Employee Benefit Levels.”
Reality Check: US Consumer Drug Costs Climb Ever Higher
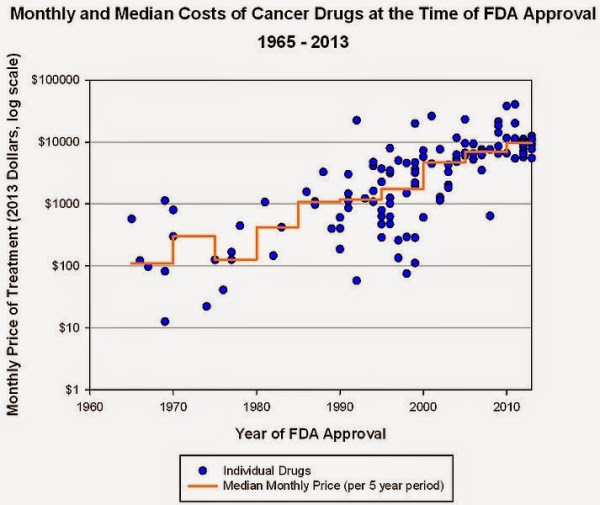
Astronomical prices of specialty drugs that treat hepatitis C, rheumatoid arthritis, cancer and other diseases are leading overall U.S. consumer prescription drug costs higher, according to pharmacists, pharmacy benefit managers and industry experts.
 Druggists and industry experts told MNI that traditional brand-name and generic drugs prices are also firming. Right alongside that, healthcare cost-sharing for prescription drugs continues to shift toward employees and others insured, by way of deductibles, co-payments, drug coverage exclusions and percentage coverage, also known as co-insurance.
The moderating impact on costs in recent years from a wave of blockbuster brand-name drugs going generic, from Lipitor to Lexapro, has faded, they said. A pharmacy benefit management company forecasted accelerating prescription-drug cost increases in 2014 for both consumers and insurers.
“It’s growing substantially this year because of the introduction of the new products in the hepatitis-C market. It’s very exciting but extremely dynamic in terms of its impact on cost this year on many of our plans,” said Peter Wickersham, senior vice president of integrated care and specialty at Prime Therapeutics, a PBM that helps control costs for 23 Blue Cross Blue Shield companies and other insurers that cover a combined 25 million members.
Total prescription drug costs, borne by consumers and Prime Therapeutics’ insurers, rose an average of 3.3% in 2013 from 2012, compared to 2.1% inflation the year before, in part due to increased utilization, Wickersham said.
“That’s about to change greatly,” Wickersham told MNI, and added that aggregate drug cost inflation should come in “north of 10%” this year, thanks in great part to Solvaldi, the hepatitis-C medication.
Specialty drugs cost insured consumers an average of $142 per prescription per month in 2013, up 15% from 2012, Wickersham said. The average specialty drug itself cost insurers $3,150 per month in 2013. Sovaldi comes in at a whopping $85,000 for a 12-week course, or about $1,000 per pill, he said.
Specialty drugs, Wickersham said, treat a relatively narrow population and comprise just 1% of total prescriptions filled. Yet by 2018, they could account for 50% of total drug costs, he said. And they aren’t the only medicine outlays on the rise.
“Starting toward the end of last year, we saw some price inflation on generic products, as well,” Wickersham said. While most generic prices are by and large stable, some “individual products are taking large price increases,” he said.
Read more here: https://mninews.marketnews.com/index.php/reality-check-us-consumer-drug-costs-climb-ever-higher?q=content/reality-check-us-consumer-drug-costs-climb-ever-higher
Reference Pricing: Pharmacy Invoice Cost (ACTUAL) for Top Selling Generic and Brand Prescription Drugs
Why is this document important? Healthcare marketers are aggressively pursuing new revenue streams to augment lower reimbursements provided under PPACA. Prescription drugs, particularly specialty, are key drivers in the growth strategies of PBMs, TPAs and MCOs pursuant to healthcare reform.
The costs shared below are what our pharmacy actually pays; not AWP, MAC or WAC. The bottom line; payers must have access to “reference pricing.” Apply this knowledge to hold PBMs accountable and lower plan expenditures for stakeholders.
_1.jpg)
When better pricing is discovered the contract language should stipulate the client be indemnified. Do not allow the PBM to limit the market check language to a similar size client, benefit design and/or drug utilization. In this case, the market check language is effectually meaningless.
The costs shared below are what our pharmacy actually pays; not AWP, MAC or WAC. The bottom line; payers must have access to “reference pricing.” Apply this knowledge to hold PBMs accountable and lower plan expenditures for stakeholders.
| How to Determine if Your Company [or Client] is Overpaying |
Step #1: Obtain a price list for generic prescription drugs from your broker, TPA, ASO or PBM every month.
Step #2: In addition, request an electronic copy of all your prescription transactions (claims) for the billing cycle which coincides with the date of your price list.
Step #3: Compare approximately 10 to 20 prescription claims against the price list to confirm contract agreement. It’s impractical to verify all claims, but 10 is a sample size large enough to extract some good assumptions.
Step #4: Now take it one step further. Check what your organization has paid, for prescription drugs, against our pharmacy cost then determine if a problem exists. When there is a 5% or more price differential (paid versus actual cost) we consider this a problem.
Multiple price differential discoveries means that your organization or client is likely overpaying. REPEAT these steps once per month.
— Tip —
Always include a semi-annual market check in your PBM contract language. Market checks provide each payer the ability, during the contract, to determine if better pricing is available in the marketplace compared to what the client is currently receiving.
When better pricing is discovered the contract language should stipulate the client be indemnified. Do not allow the PBM to limit the market check language to a similar size client, benefit design and/or drug utilization. In this case, the market check language is effectually meaningless.
Click here to register for: “How To Slash the Cost of Your PBM Service, up to 50%, Without Changing Providers or Employee Benefit Levels.”
Restrictive formularies: A path to more affordable drug prices
At the end of June the New York Times examined how pharmacy benefit managers (PBMs), hope to force price competition among pharmaceutical companies. PBMs act as agents for payers — private insurers and employers — to negotiate drug purchasing contracts and manage formularies. The plan calls for substantially restricting the drug formularies, i.e., the lists of drugs they will cover.
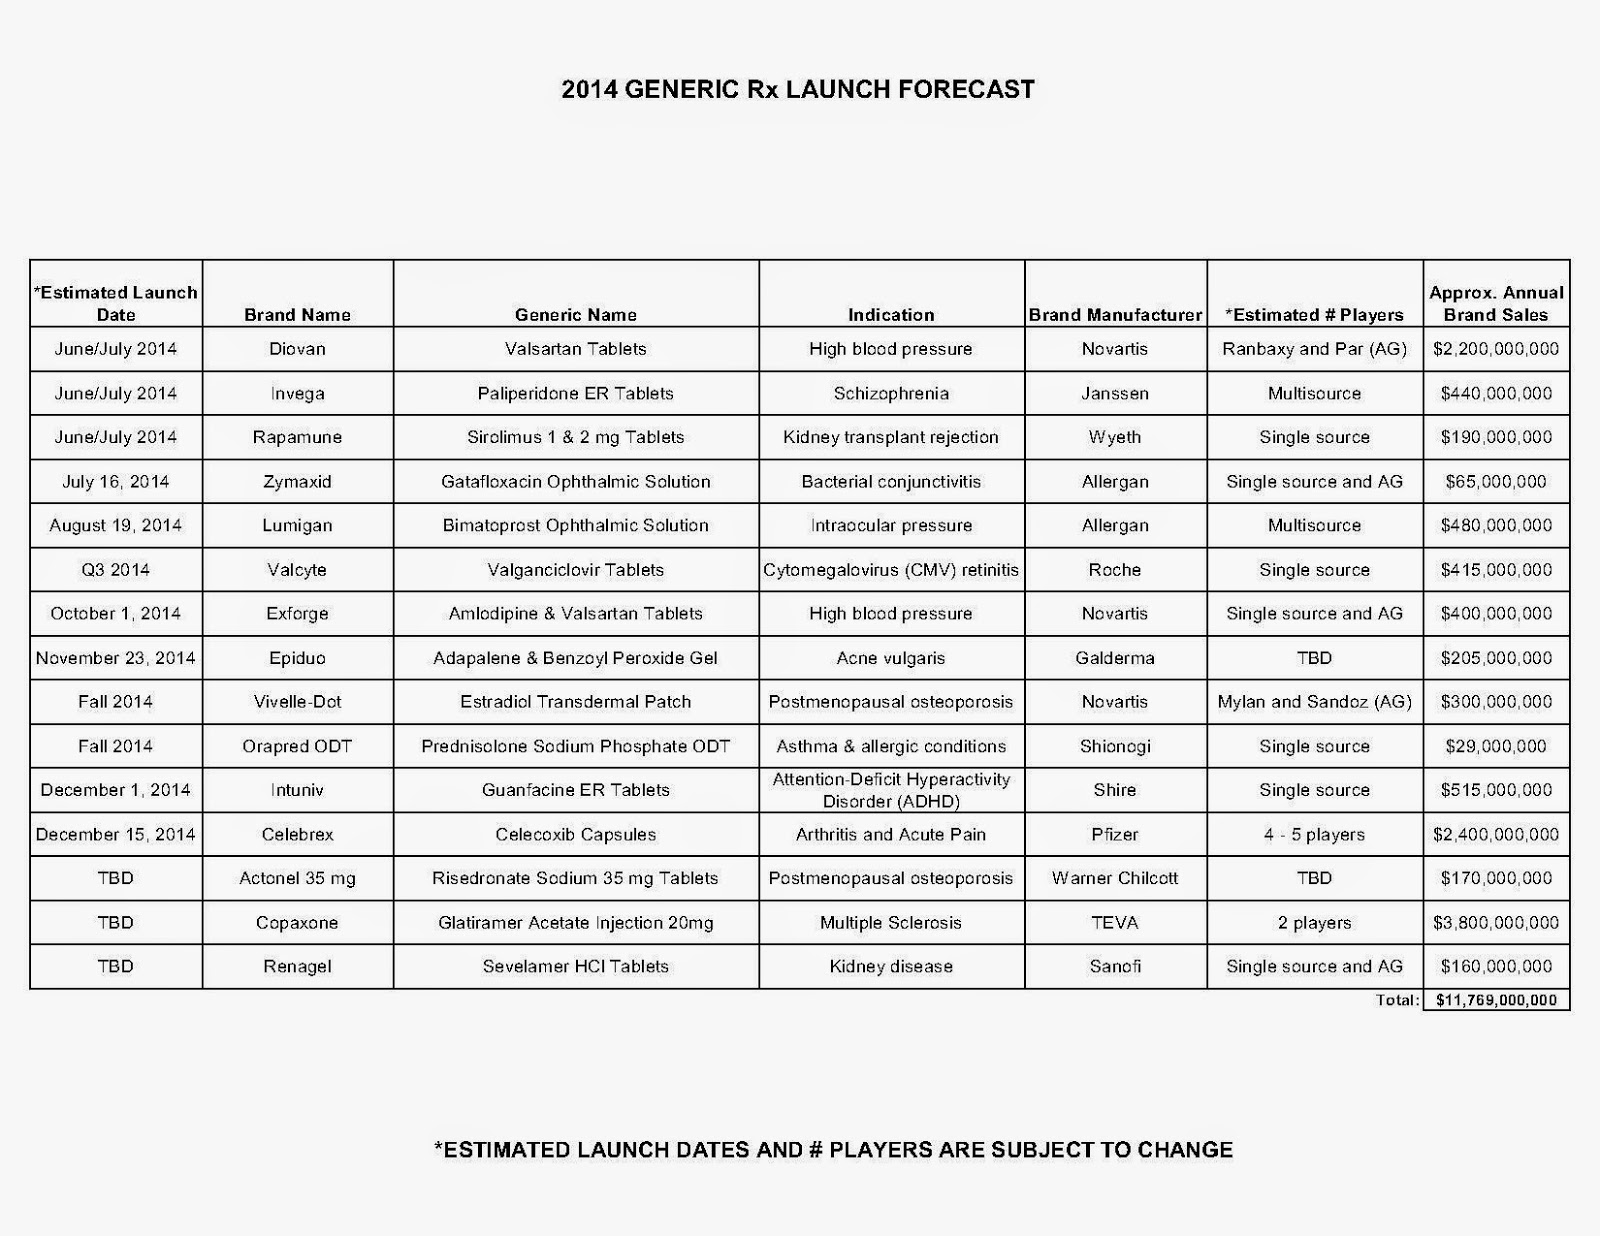
 In cases with three, four or five competing brands in a therapeutic class, the PBMs would alter the current practice in which most of them are covered. Instead the PBMs and their insurance company clients would cover only one or, at most, two brands. The idea is that intense competition among pharmas to obtain one of these preferred coverage positions would oblige them to abandon their smug, cartel-like approach in which the prices of various brands differ only marginally.
Pharmas will immediately fight these more restrictive formularies by designing prospective clinical studies in an effort to differentiate their brands and, thereby, make the case that insurers should cover all competing brands in every therapeutic category. Payers can stymie this pharma effort to keep drug prices high if the insurers use their own coverage data to create and pay for retrospective outcomes studies and then insist that those results form the basis of formulary inclusion/exclusion decisions. By using that approach, payers in most cases can treat the brands competing for first-line use among the majority of patients as commodity products. That would allow insurers to select the low-priced brand as the preferred medication.
Pharmas with excluded brands will doubtlessly combat that effort by putting forth their own outcomes data to justify the use of those products, but the PBMs can restrict the non-preferred brands to small, niched segments of patients. Certain brands are more appropriate for outlier patient groups and payers can approve the more expensive products for such use without substantially increasing total drug costs.
If payers succeed in this effort, it means that market share distributions of branded drugs in the various therapeutic categories will change from the classic 50%-25%-12½%-6¼%-3⅛% to something more closely resembling an 80%-5%-3%-1% split. Pharma companies know if this practice takes hold, most products at most companies will obtain market shares in that 1-5% range. That explains their rush to create product lines of expensive specialty products, thereby making more money despite selling fewer pills and injections.
The approach of managing prescription drug use with outcomes analysis is far more rational than the exorbitant pricing that currently exists in the U.S. under the fiction of a free market. In fact the economics of health care resources would come closer to an actual market if payers took some initiative by aggressively creating and using their own in-house data to stratify the patients they cover.
That would allow them to reserve the expensive brands for the limited segment of patients, in defined circumstances, who need those medications instead of less costly treatments. Payers to this point have not made this effort, preferring instead to rely on their traditionally passive, live-on-the-float methods.
Read more at http://www.philly.com/philly/blogs/healthcare/Restrictive-formularies-The-path-to-more-affordable-drug-prices.html#rZDhX6HzwRtrro9f.99
Specialty Drugs: A Proactive Approach to Sustained Cost Containment
Specialty drugs have been known for their high costs well before Sovaldi started making headlines at the end of 2013. Sovaldi, the now infamous $1,000 a pill drug used to treat hepatitis C, got plenty of media attention; however, no real solutions to the high cost have been adopted. This leaves the management of this $90,000 treatment, along with other specialty drugs, in the hands of health plans. Specialty drugs fall into two distinct categories when it comes to the administration and management of health plan costs.
 Sovaldi and other new biologic medications fall are patent-protected drugs with no generic or brand substitutes. The pricing power of drug manufacturers with this type of monopoly is powerful and alternative ways of management must be considered. The first step a health plan can take is to pre-authorize the treatment by verifying the treatment plan with the member’s physician.
 Payors must engage specialty pharmacies, which can aid in the patient-centric high-touch model of care required when dealing with members taking specialty medications. The TPA and specialty pharmacy both have a role in order to ensure the appropriateness of care and compliance with the treatment plan. One key to effectively monitoring and managing this class of specialty drugs is continuous engagement with the patient and the provider.
Exclude extremely high-priced medications when an effective alternative exists; this is where the largest impact on the cost of drugs can be made. Drugs falling into this category have been evaluated and the FDA has determined that an effective and cheaper alternative exists. Many health plans have step therapy programs in place that require trying a cheaper alternative drug before authorizing the more expensive brand drug.
The key to managing escalating costs with specialty drugs is to be proactive and respond quickly to the changing environment. For the first category of drugs (when no alternative exists), this requires closely monitoring the FDA approval process. When a new drug is approved, the health plan should work with the specialty pharmacy to develop a plan of action to manage patients who will need the new treatment.
For drugs with patents expiring, proactive outreach to members will let them know of available generic alternatives and how to coordinate a change in treatment with their physicians. In either case, an aggressive management strategy is the only solution to mitigate the potential for wasteful spending.
For drugs with patents expiring, proactive outreach to members will let them know of available generic alternatives and how to coordinate a change in treatment with their physicians. In either case, an aggressive management strategy is the only solution to mitigate the potential for wasteful spending.
Reference Pricing: Pharmacy Invoice Cost (ACTUAL) for Top Selling Generic and Brand Prescription Drugs
Why is this document important? Healthcare marketers are aggressively pursuing new revenue streams to augment lower reimbursements provided under PPACA. Prescription drugs, particularly specialty, are key drivers in the growth strategies of PBMs, TPAs and MCOs pursuant to healthcare reform.
The costs shared below are what our pharmacy actually pays; not AWP, MAC or WAC. The bottom line; payers must have access to “reference pricing.” Apply this knowledge to hold PBMs accountable and lower plan expenditures for stakeholders.
_1.jpg)
When better pricing is discovered the contract language should stipulate the client be indemnified. Do not allow the PBM to limit the market check language to a similar size client, benefit design and/or drug utilization. In this case, the market check language is effectually meaningless.
The costs shared below are what our pharmacy actually pays; not AWP, MAC or WAC. The bottom line; payers must have access to “reference pricing.” Apply this knowledge to hold PBMs accountable and lower plan expenditures for stakeholders.
| How to Determine if Your Company [or Client] is Overpaying |
Step #1: Obtain a price list for generic prescription drugs from your broker, TPA, ASO or PBM every month.
Step #2: In addition, request an electronic copy of all your prescription transactions (claims) for the billing cycle which coincides with the date of your price list.
Step #3: Compare approximately 10 to 20 prescription claims against the price list to confirm contract agreement. It’s impractical to verify all claims, but 10 is a sample size large enough to extract some good assumptions.
Step #4: Now take it one step further. Check what your organization has paid, for prescription drugs, against our pharmacy cost then determine if a problem exists. When there is a 5% or more price differential (paid versus actual cost) we consider this a problem.
Multiple price differential discoveries means that your organization or client is likely overpaying. REPEAT these steps once per month.
— Tip —
Always include a semi-annual market check in your PBM contract language. Market checks provide each payer the ability, during the contract, to determine if better pricing is available in the marketplace compared to what the client is currently receiving.
When better pricing is discovered the contract language should stipulate the client be indemnified. Do not allow the PBM to limit the market check language to a similar size client, benefit design and/or drug utilization. In this case, the market check language is effectually meaningless.

- Go to the previous page
- 1
- …
- 115
- 116
- 117
- 118
- 119
- 120
- 121
- …
- 132
- Go to the next page